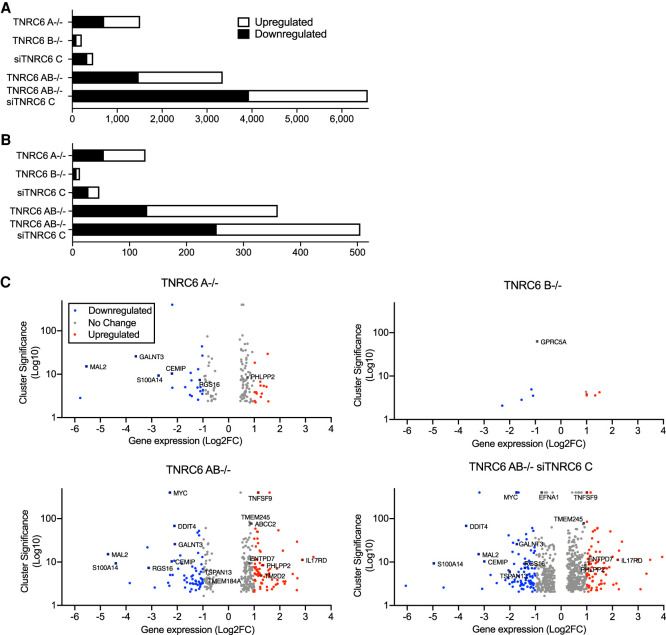
FIGURE 2.
Association of AGO2 protein binding and gene expression in TNRC6 knockout cells. (A) Total number of significantly up- or down-regulated genes in knockout cell lines. (B) Total number of significantly up- or down-regulated genes in knockout cell lines that overlap with AGO2 binding sites in coding sequences (CDS) and in the 3′ untranslated regions (3′UTR). (C) Volcano plots of gene expression in TNRC6 knockout cell lines.

