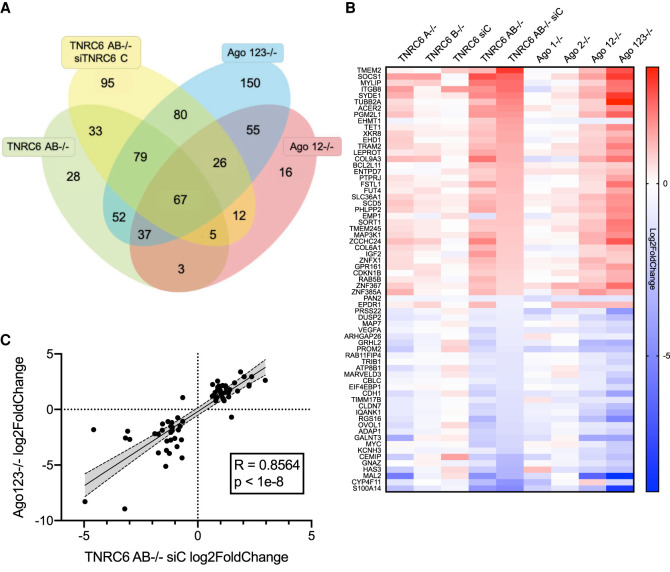
FIGURE 3.
Consistent variation for AGO2 protein binding cluster's gene expression changes in TNRC6 and AGO knockout cells. (A) Venn diagram showing the overlap of gene expression changes associated with AGO2 binding within 3′-UTRs. AGO2 binding was determined by eCLIP as described (Chu et al. 2020) and was required for inclusion. (B) Heatmap showing gene expression changes (Log2FoldChange) shared by TNRC6 and AGO knockout cell lines. (C) Correlation plot of the 67 overlapping genes shown in B of AGO 123−/− and TNRC6 AB−/− siC log2FoldChanges. Shaded region is 95% confidence band.

