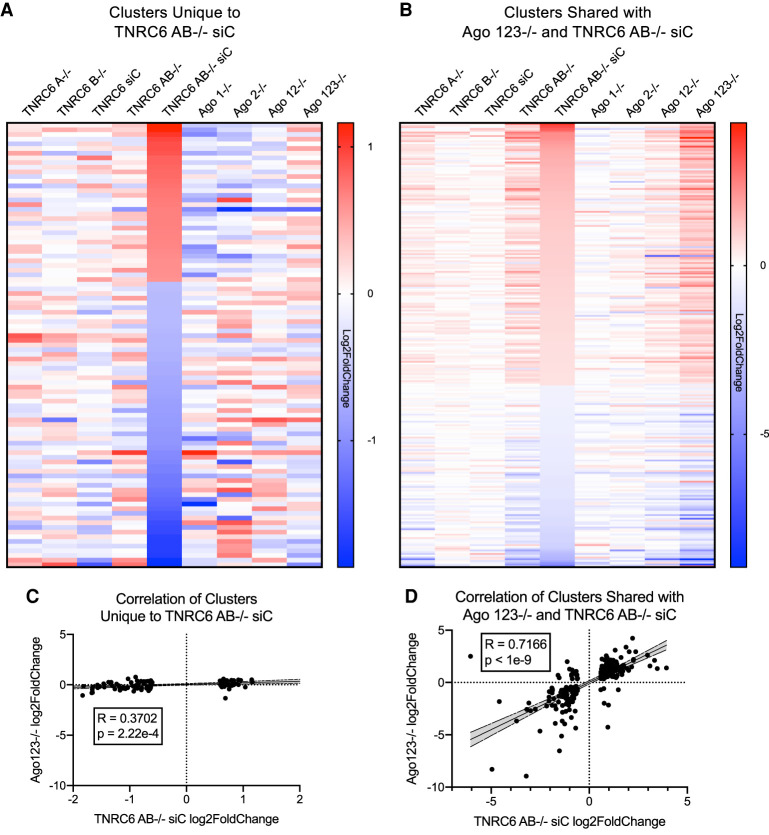
FIGURE 4.
Comparison of gene expression in TNRC6 and AGO knockout cells. (A) Heatmap of Log2FoldChange gene expression changes of 95 genes with AGO2 protein binding clusters that change significantly only in the TNRC6AB−/− siTNRC6C cells. (B) Heatmap of Log2FoldChange gene expression changes of 252 genes with AGO2 clusters that change significantly in TNRC6 AB−/− siTNRC6C and AGO123−/− cells (not including the 67 genes previously shown in Fig. 3B). (C) Correlation plot of the 95 genes unique to TNRC6 AB−/− siC shown in A of AGO 123−/− and TNRC6 AB−/− siC log2FoldChanges. Shaded region is 95% confidence band. (D) Correlation plot of the 252 genes changed in AGO123−/− and TNRC6 AB−/− siC in shown in B of AGO 123−/− and TNRC6 AB−/− siC log2FoldChanges. Shaded region is 95% confidence band.

