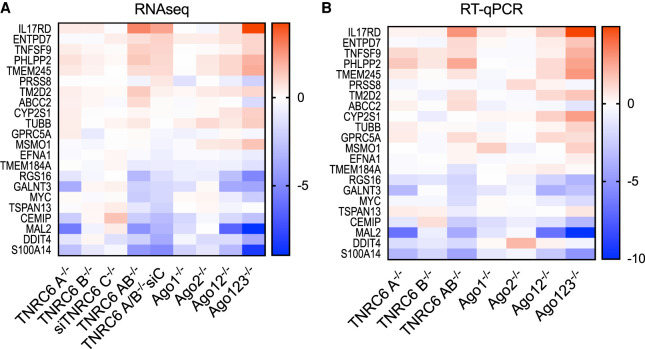
FIGURE 5.
Consistent variation of gene expression in cells with highly ranked AGO2 protein binding clusters. (A) Heatmap of gene expression changes from TNRC6 knockout and AGO knockout cell lines from RNA sequencing for 22 cluster genes examined in Chu et al. (2020). (B) Heatmap of gene expression changes from TNRC6 knockout and AGO knockout cell lines from RT-qPCR for 22 cluster genes examined in Chu et al. (2020).

