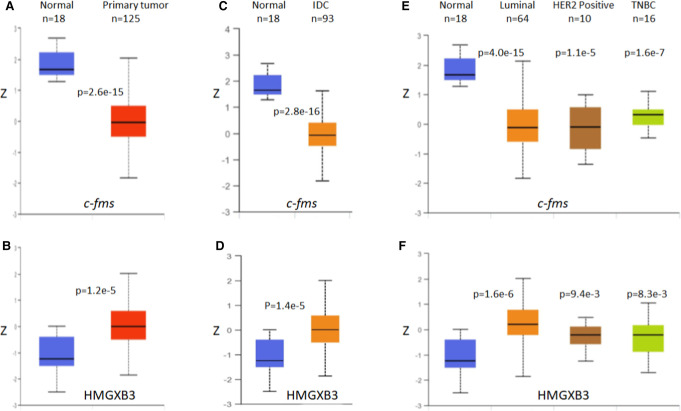
FIGURE 7.
The protein expression of c-fms and HMGXB3 in breast cancer (UALCAN). (A) The expression of c-fms protein in breast cancer tissues is lower than that in normal tissues. (B) In contrast, the expression of HMGXB3 protein in breast cancer tissues is higher than that in normal tissues. (C,D) Similar trends are shown in histologic subtypes, and (E,F) breast cancer subclasses. Z-values on the y-axis represent standard deviations from the median across samples for the given cancer type. Log2 spectral count ratio values from CPTAC were first normalized within each sample profile, then normalized across samples. P-value less than 0.05 indicates significant differences between samples. (IDC) Infiltrating ductal carcinoma, (TNBC) triple negative breast cancer.

