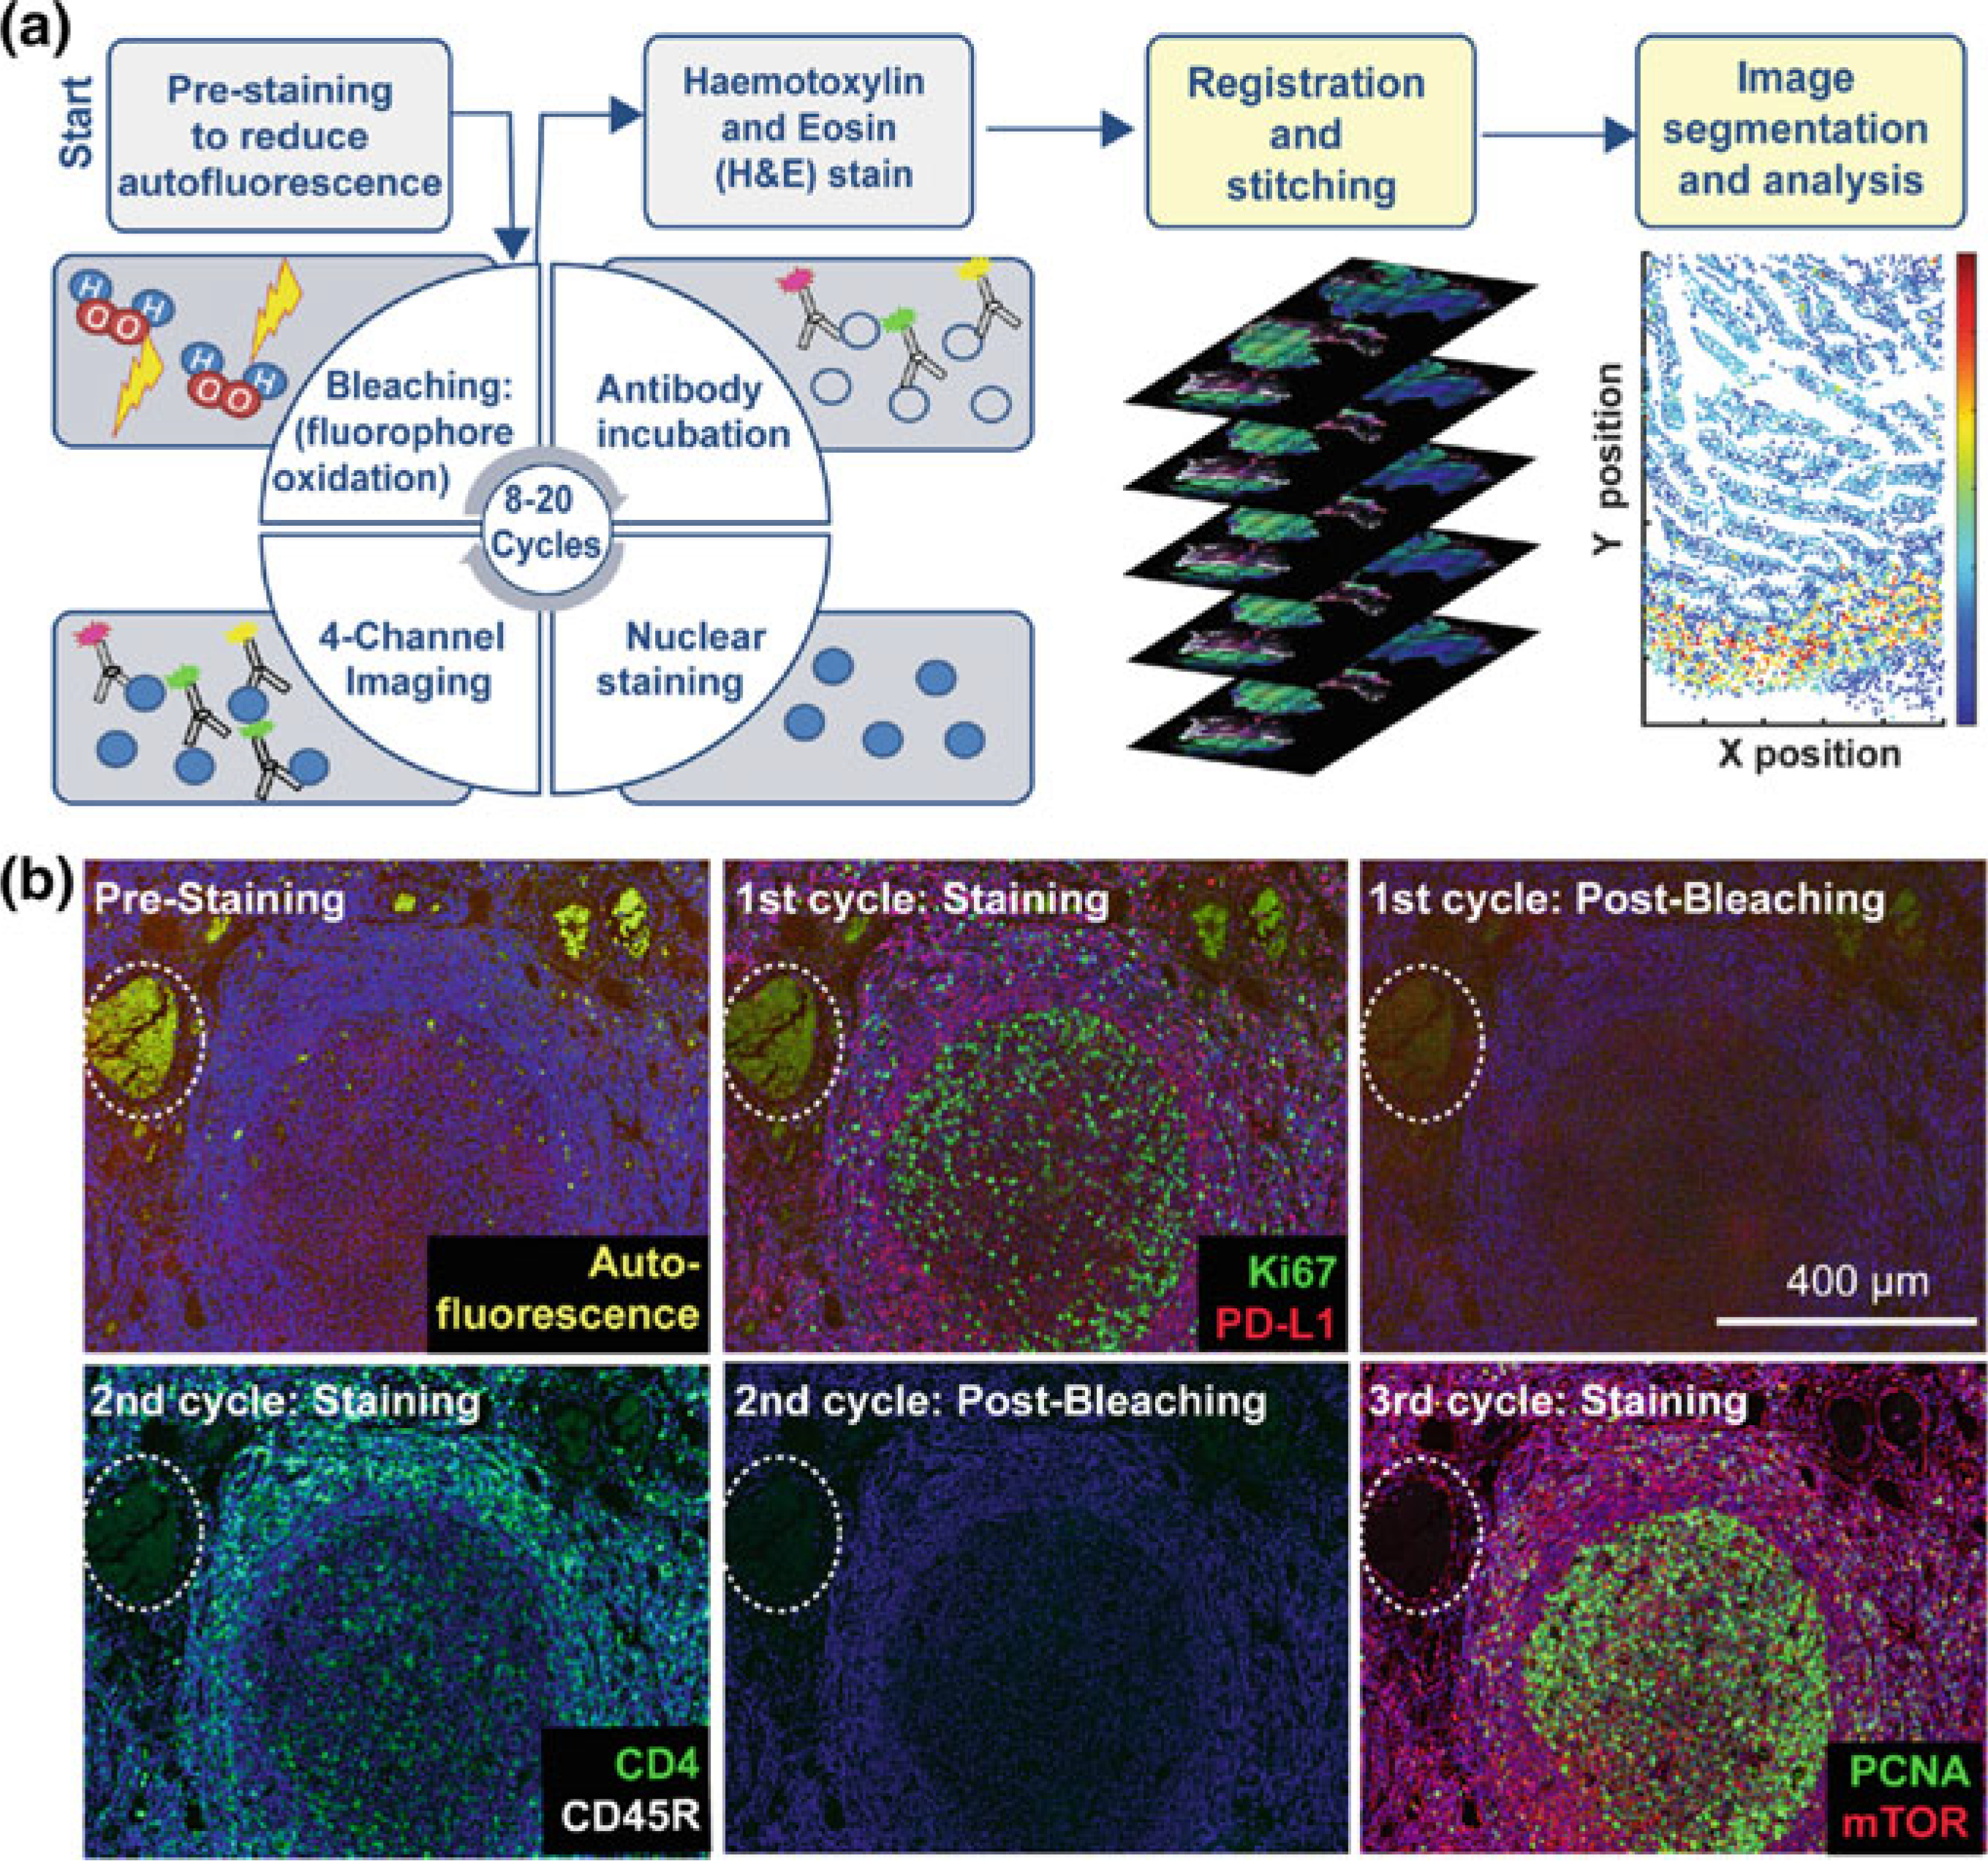
Fig. 2.5.

Steps in the t-CyCIF process. a Schematic of the cyclic process whereby t-CyCIF images are assembled via multiple rounds of four-color imaging. b Image of human tonsil prior to pre-staining and then over the course of three rounds of t-CyCIF. The dashed circle highlights a region with auto-fluorescence in both green and red channels (used for Alexa-488 and Alexa-647, respectively) and corresponds to a strong background signal. With subsequent inactivation and staining cycles (three cycles are shown here), this background signal becomes progressively less intense; the phenomenon of decreasing background signal and increasing signal-to-noise ratio as cycle number increases was observed in several staining settings (Modified from [68] DOI:https://doi.org/10.7554/eLife.31657. © 2018, Lin et al. Reprinted under the terms of the Creative Commons Attribution License)
