. 2021 Aug 17;10:e64846. doi: 10.7554/eLife.64846

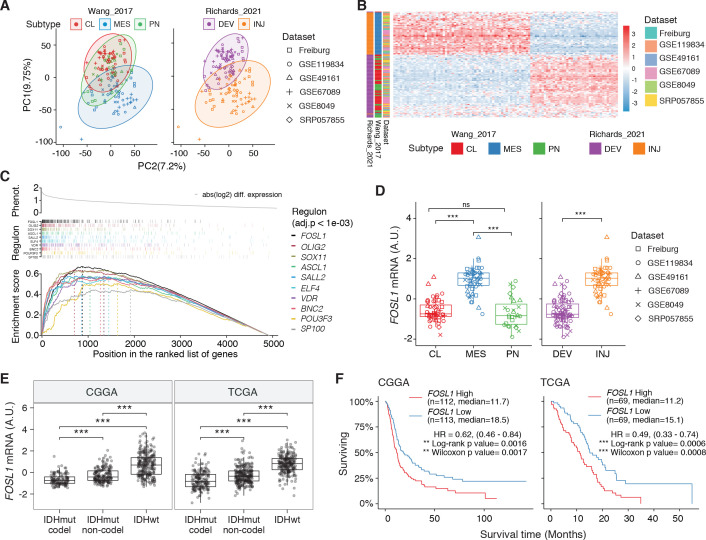
Figure 1. FOSL1 is a bona fide regulator of the glioma-intrinsic mesenchymal (MES) transcriptional signature.

(A) Principal component (PC) analysis of the brain tumor stem cells (BTSCs) expression dataset. (B) Heatmap of the top 100 differentially expressed genes between MES and non-MES BTSCs. (C) One-tail gene set enrichment analysis (GSEA) of the top 10 scoring transcription factors (TFs) in the master regulator analysis (MRA). (D) FOSL1 mRNA expression in the BTSCs dataset. One-way ANOVA with Tukey multiple pairwise comparison, ***p≤0.001, ns = not significant. (E) FOSL1 mRNA expression in the CGGA and TCGA datasets. Tumors were separated according to their molecular subtype classification. One-way ANOVA with Tukey multiple pairwise comparison, ***p≤0.001. (F) Kaplan–Meier survival curves of IDH-wt gliomas in the CGGA and TCGA datasets stratified based on FOSL1 expression (see Materials and methods for details).

Figure 1—source data 1. Source data of Figure 1A, B, D–F.
elife-64846-fig1-data1.xlsx (183.8KB, xlsx)

Figure 1.

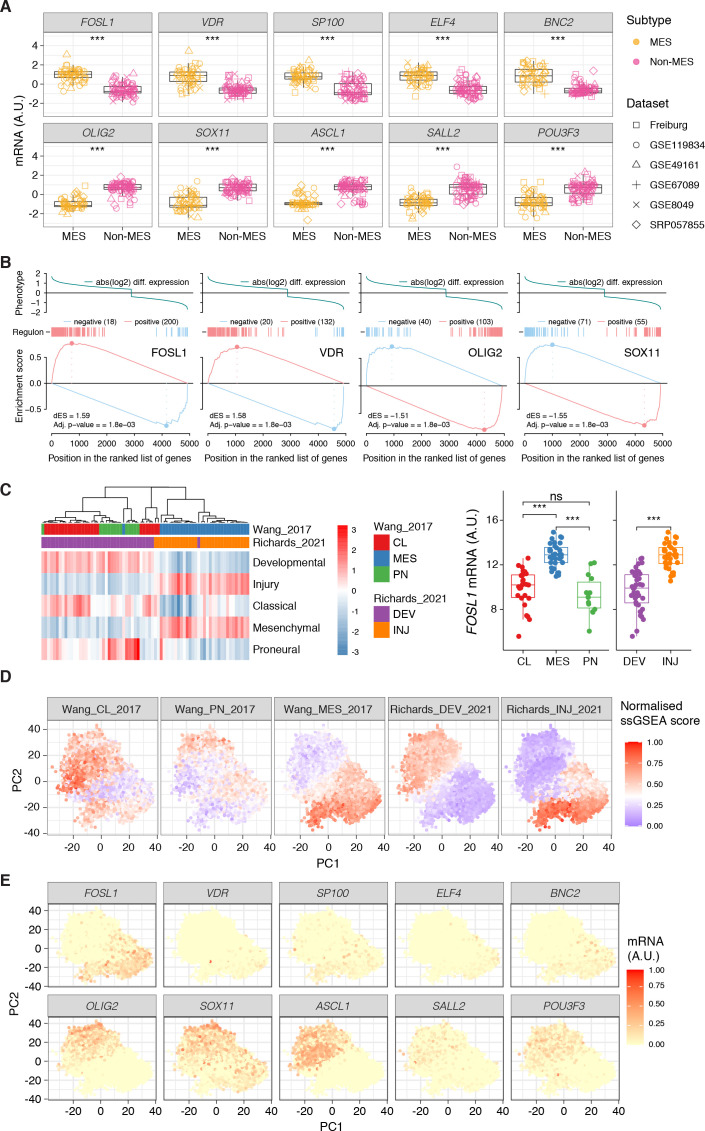
Figure 1—figure supplement 1. Expression, bulk and single-cell RNA-seq, of the top 10 transcription factors (TFs) identified in the master regulator analysis (MRA).

Figure 1—figure supplement 1.

(A) mRNA expression of the top 10 scoring TFs in the MRA of the brain tumor stem cells (BTSCs) dataset, comparing mesenchymal (MES) versus non-MES. Student’s t test, ***p .001. (B) Two-tailed gene set enrichment analysis (GSEA) showing positive or negative targets for the top four representative TFs in the MRA. (C) FOSL1 mRNA expression in the Richards glioma stem cells (GSCs) bulk RNA-seq dataset (n = 72; right panel). ) Single-sample gene set enrichment analys (ssGSEA) was performed to identify the GSCs subtypes (left panel). Tumors were separated according to their expression subtype classification. One-way ANOVA with Tukey multiple pairwise comparison, ***p≤0.001, **p≤0.01, ns = not significant. (Dis ssGSEA scores of the Wang_2017 and Richards_2021 transcriptional subtypes performed on the scRNA-seq GSCs data (65,655 cells from 28 samples) from Richards et al., 2021. (E) mRNA expression of the top 10 scoring TFs on the scRNA-seq GSCs data from Richards et al., 2021.
Figure 1—figure supplement 1—source data 1. Source data of Figure 1—figure supplement 1A, C, D, and E.
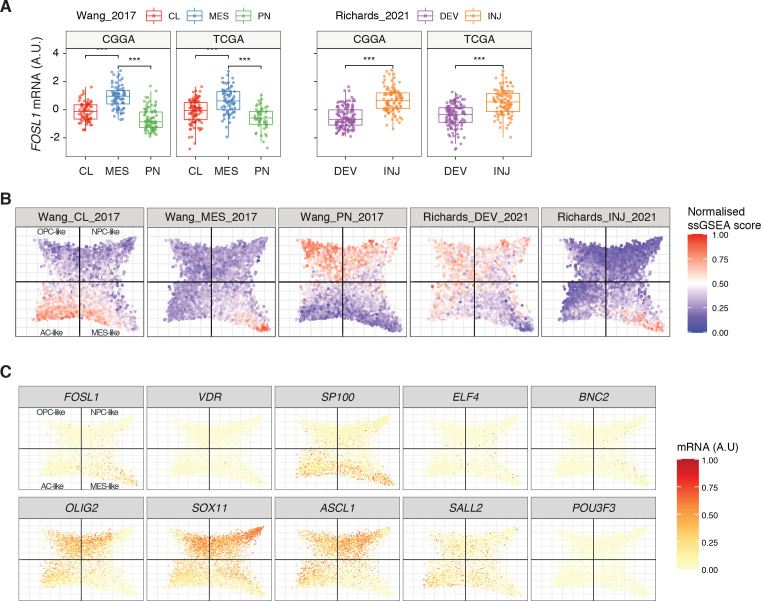
Figure 1—figure supplement 2. Expression in human glioblastomas (GBMs) of FOSL1 and the top 10 transcription factors (TFs) identified in the master regulator analysis (MRA).

Figure 1—figure supplement 2.

(A) FOSL1 mRNA expression in IDH-wt tumors of the CGGA and TCGA datasets. Tumors were separated according to their expression subtype classification. One-way ANOVA with Tukey multiple pairwise comparison, ***p≤0.001, **p≤0.01, ns = not significant. (B) Single-sample gene set enrichment analysis (ssGSEA) scores of the Wang_2017 and Richards_2021 transcriptional subtypes performed on the scRNA-seq data (6863 cells) from Neftel et al., 2019. (C) Normalized mRNA expression of the top 10 scoring TFs on the scRNA-seq tumor data from Neftel et al., 2019.
Figure 1—figure supplement 2—source data 1. Source data of Figure 1—figure supplement 2A–C.