. 2021 Aug 17;10:e64846. doi: 10.7554/eLife.64846

Figure 2. NF1 is a functional modulator of mesenchymal (MES) transcriptional signatures through FOSL1 expression regulation.

(A) Heatmap of the subtypes single-sample gene set enrichment analysis (ssGSEA) scores and NF1 genetic alterations of the IDH-wt gliomas in the TCGA dataset. (B) Frequency of NF1 alterations in MES and non-MES IDH-wt gliomas. Colors are as in panel (A). (C) FOSL1 mRNA expression in IDH-wt gliomas, stratified according to NF1 alterations. Colors are as in panel (A). Student’s t test, p=0.018. (D) Correlation of FOSL1 and NF1 mRNA expression in IDH-wt gliomas. Colors are as in panel (A). Pearson correlation, R = −0.044, p=7.8e-12. (E) qRT-PCR analysis of FOSL1 expression upon NF1-GRD overexpression in BTSC 232 and BTSC 233 cells. (F) Western blot analysis of whole-cell extract of BTSC 233 cells showing CHI3L1 mesenchymal marker expression upon NF1-GRD transduction; α-tubulin was used as loading control. Two biological replicates are shown. (G) Gene set enrichment analysis (GSEA) results of BTSC 233 cells transduced with NF1-GRD expressing lentivirus versus Ctrl. NES: normalized enrichment score. (H) qRT-PCR analysis of FOSL1 expression upon NF1 knockdown in BTSC 3021 and BTSC 3047 cells. (I) GSEA results of BTSC 3021 transduced with shNF1_5 versus Ctrl. (J) qRT-PCR analysis of MES genes expression upon NF1-GRD and FOSL1 co-expression in BTSC 232 and BTSC 233 cells. qRT-PCR data in (E), (H), and (J) are presented as mean ± SD (n = 3, technical replicates), normalized to 18S rRNA expression; Student’s t test, *p≤0.05, **p≤0.01, ***p≤0.001, ns = not significant.

Figure 2—source data 1. Source data of Figure 2F.
Figure 2—source data 2. Source data of Figure 2A, C–E, G–J.

Figure 2.

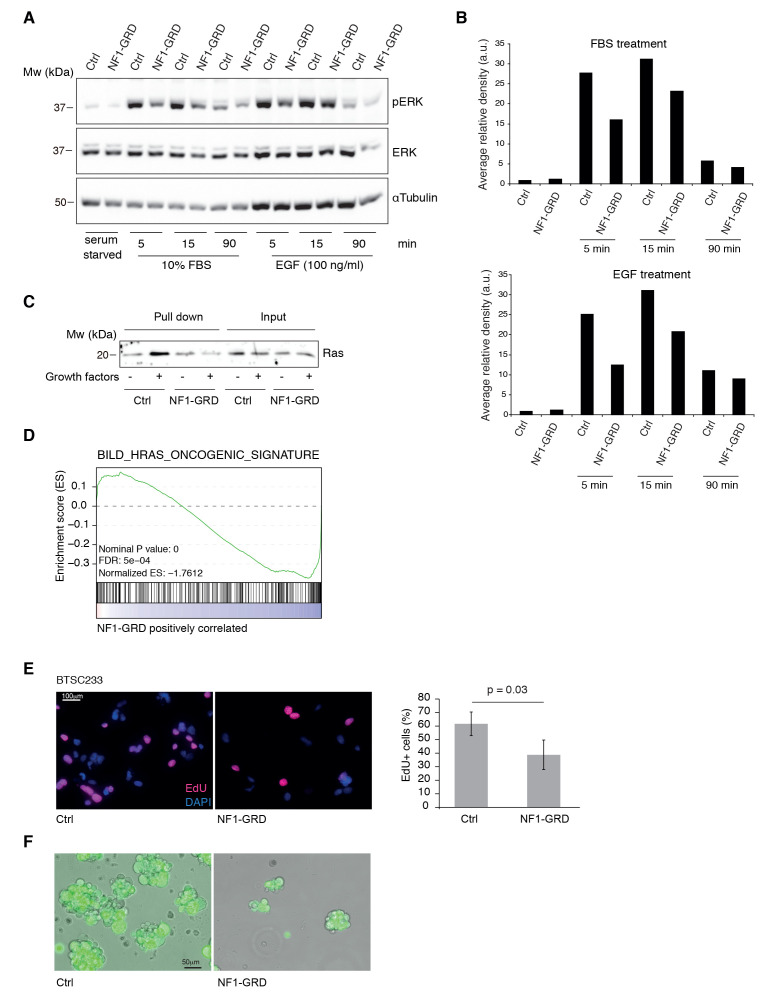
Figure 2—figure supplement 1. NF1-GRD expression leads to downregulation of RAS signaling.

Figure 2—figure supplement 1.

(A) Western blot analysis of ERK and pERK expression in BTSC 233 cells transduced with NF1-GRD expressing lentivirus and stimulated with 10% FBS or 100 ng/ml EGF. α-Tubulin is included as loading control. (B) Densitometric analysis of western blot in (A). (C) Western blot analysis of active Ras pull-down assay in BTSC 233 expressing NF1-GRD or control in the presence or absence of growth factors. (D) Gene set enrichment analysis (GSEA) of Ras-induced oncogenic signature in BTSC 233 cells transduced with NF1-GRD expressing lentivirus versus Ctrl. (E) EdU staining of BTSC 233 cell line upon NF1-GRD overexpression, counterstained with DAPI. Quantification of the fluorescence intensity of EdU staining is shown in the right panel. Ctrl, n = 4; NF1-GRD, n = 4. (F) Micrographs showing representative BTSC 233 Ctrl and NF1-GRD grown for 2 weeks after cell transduction.
Figure 2—figure supplement 1—source data 1. Source data of Figure 2—figure supplement 1A.
Figure 2—figure supplement 1—source data 2. Source data of Figure 2—figure supplement 1C.
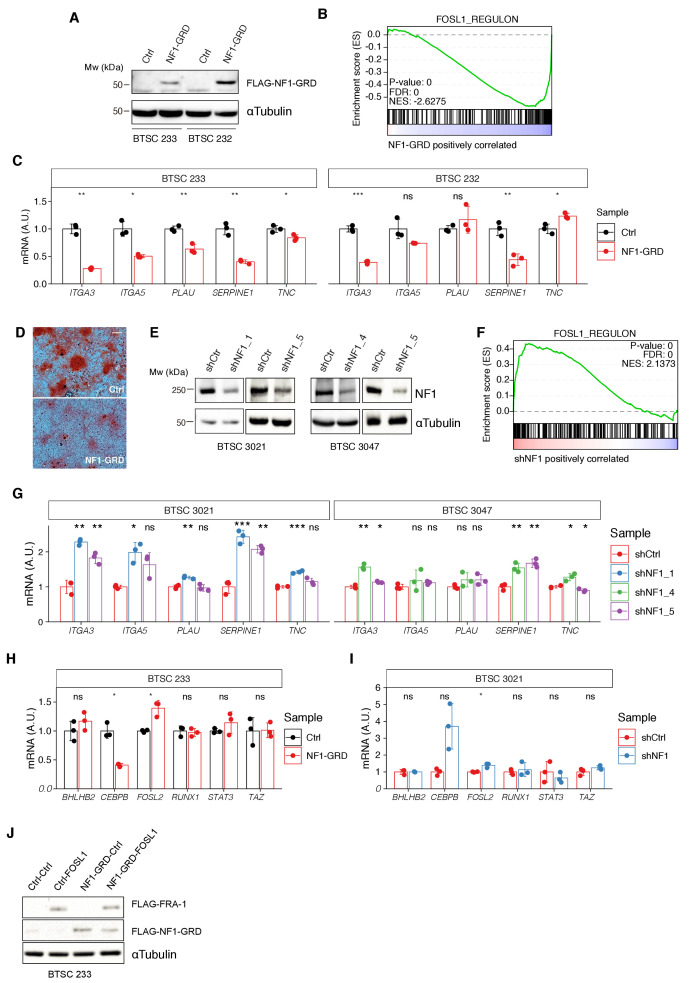
Figure 2—figure supplement 2. Modulation of NF1 expression regulates FOSL1 targets and mesenchymal genes.

Figure 2—figure supplement 2.

(A) Western blot analysis of FLAG-NF1-GRD expression in mesenchymal (MES) cells (BTSC 233 and 232). (B) Gene set enrichment analysis (GSEA) of FOSL1 targets signature in BTSC 233 cells transduced with NF1-GRD or Ctrl vector. (C) qRT-PCR analysis of mesenchymal FOSL1 targets (ITGA3, ITGA5, PLAU, SERPINE1, and TNC) in BTSC 233 and 232 cells transduced with NF1-GRD expressing lentivirus. Data are normalized to 18S rRNA expression. (D) Osteogenesis differentiation assay of BTSC 233 transduced as indicated above. Alzarin Red staining indicates osteogenesis differentiation. Scale bar represents 200 µm. (E) Western blot analysis of NF1 expression upon NF1 knockdown in non-MES cells (BTSC 3021 and 3047). (F) GSEA of FOSL1 targets signature in BTSC 3021 cells transduced with shNF1 or shCtrl. (G) qRT-PCR analysis of mesenchymal FOSL1 targets BTSC 3021 and 3047 cells transduced with shNF1 expressing lentiviruses. Data are normalized to 18S rRNA expression. (H, I) qRT-PCR analysis of MES genes master regulators expression (BHLHB2, CEBPB, FOSL2, RUNX1, STAT3, and TAZ) upon NF1-GRD overexpression in BTSC 233 (H) or NF1 knockdown in BTSC 3021 cells (I). Data are normalized to GAPDH or 18S rRNA expression, respectively. (J) Western blot analysis of FLAG-NF1-GRD and FLAG-FRA-1 expression in BTSC 233 cells. qRT-PCR data in (C), (G), (H), and (I) are presented as mean ± SD (n = 3, technical replicates); Student’s t test, ns = not-significant, *p≤0.05, **p≤0.01, ***p≤0.001.
Figure 2—figure supplement 2—source data 1. Source data of Figure 2—figure supplement 2A.
Figure 2—figure supplement 2—source data 2. Source data of Figure 2—figure supplement 2E.
Figure 2—figure supplement 2—source data 3. Source data of Figure 2—figure supplement 2J.
Figure 2—figure supplement 2—source data 4. Source data of Figure 2—figure supplement 2C, G–I.
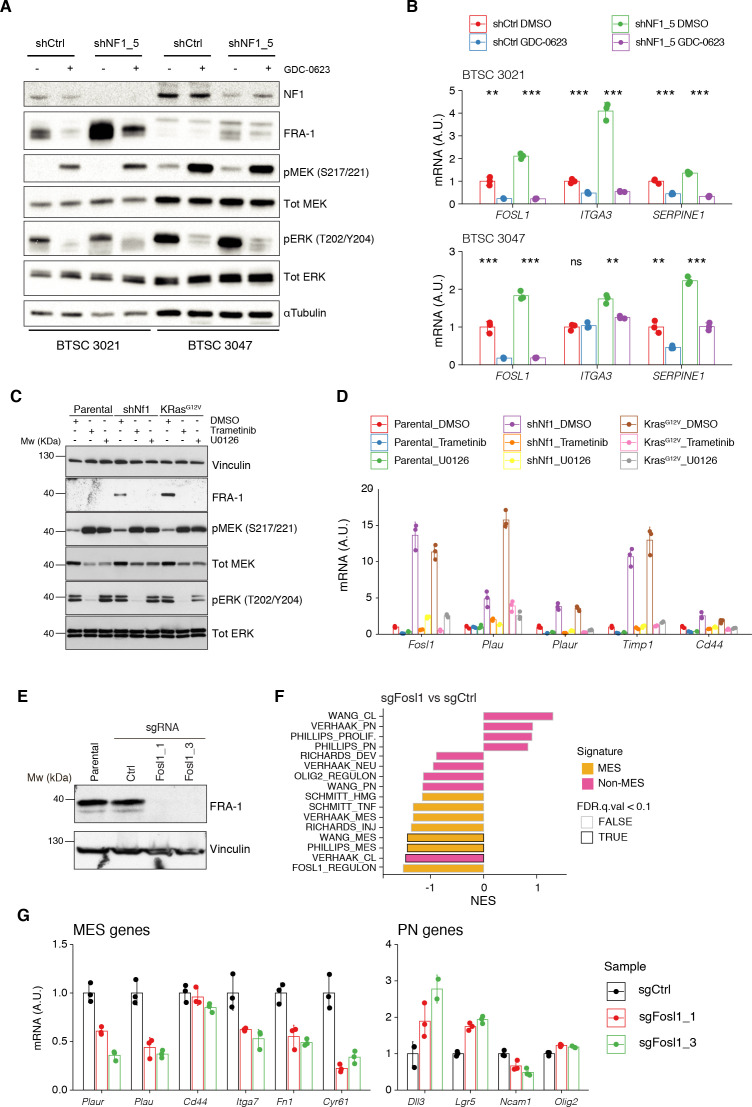
Figure 2—figure supplement 3. MAPK inhibition reverts the effects of NF1 silencing on FOSL1 and mesenchymal genes expression.

Figure 2—figure supplement 3.

(A) Western blot analysis of non-mesenchymal (non-MES) cells (BTSC 3021 and 3047) transduced with shCtrl or shNF1_5 and treated with the MEK inhibitor GDC-0623 (1 μM for 16 hr); α-tubulin was used as loading control. (B) qRT-PCR analysis of FOSL1 and the MES genes ITGA3 and SERPINE1 in samples treated as in (A). Data are presented as mean ± SD (n = 3), normalized to 18S rRNA expression; Student’s t test of DMSO vs. GDC-0623 (either shCtrl or shNF1_5), **p≤0.01, ***p≤0.001, ns = not significant. (C) Western blot analysis using the specified antibodies of p53-null NSCs, parental and infected with shNf1 or KrasG12V and treated for 16 hr with the MAPK inhibitors trametinib (200 nM) or U0126 (10 μM); vinculin was used as loading control. (D) qRT-PCR analysis of Fosl1 and the MES genes (Plau, Plaur, Timp1, and Cd44), in samples treated as in (C). Data are presented as mean ± SD (n = 3, technical replicates), normalized to Actin expression. (E) FRA-1 expression detected by western blot in p53-null shNf1 NSCs upon transduction with sgRNAs targeting Fosl1; vinculin was used as loading control. (F) Gene set enrichment analysis (GSEA) results of p53-null shNf1 NSCs sgFosl1_1 and sgFosl1_3 versus sgCtrl neural stem cells (NSCs); n = 3 for each group. (G) mRNA expression of MES (left panel) and PN genes (right panel) in sgCtrl and sgFosl1 in p53-null shNf1 NSCs. Data from a representative of two experiments are presented as mean ± SD (n = 3, technical replicates), normalized to Gapdh expression.
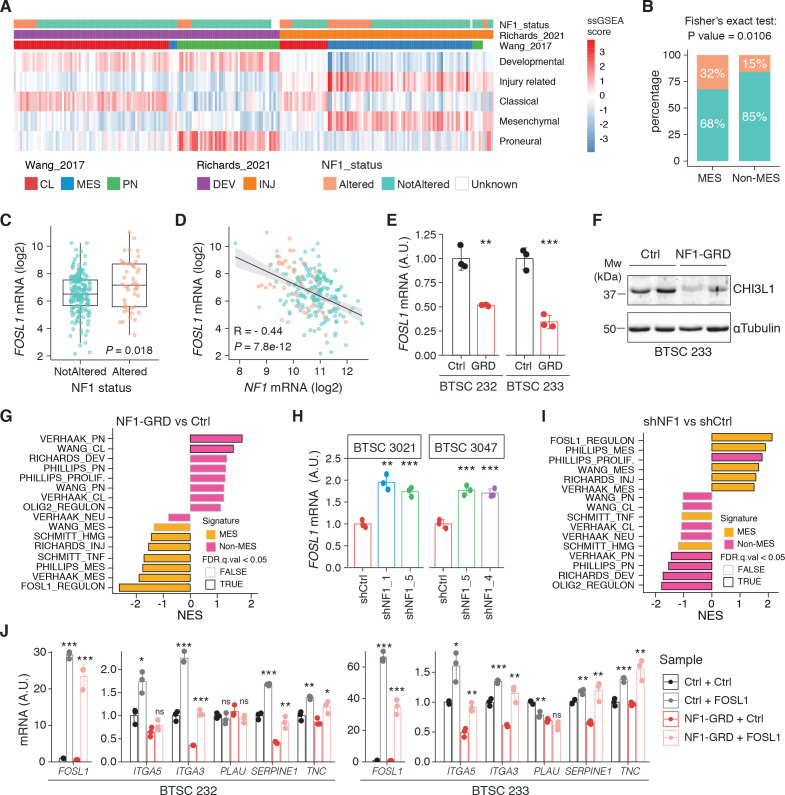
Figure 2—figure supplement 3—source data 1. Source data of Figure 2—figure supplement 3A.
Figure 2—figure supplement 3—source data 2. Source data of Figure 2—figure supplement 3C.
Figure 2—figure supplement 3—source data 3. Source data of Figure 2—figure supplement 3E.
Figure 2—figure supplement 3—source data 4. Source data of Figure 2—figure supplement 3B, D, F, and G.