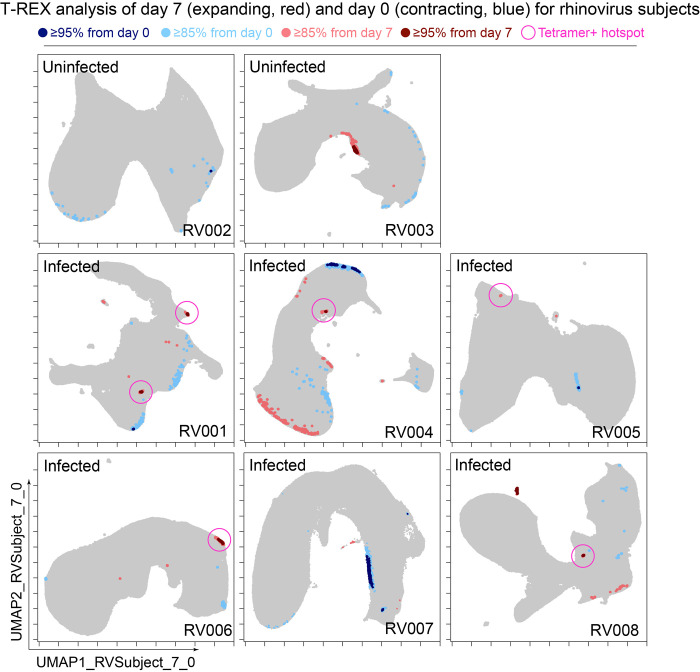
Figure 3. Cells in regions of significant change between day 0 and day 7 were typically in tetramer+ hotspots.
Tracking Responders EXpanding (T-REX) plots of regions of significant change (blue and red) are shown on Uniform Manifold Approximation (UMAP) axes for CD4+ T cells from eight rhinovirus challenge study individuals. Solid pink circles indicate tetramer+ hotspots that also contained cells that were in regions of marked expansion ≥85%.

