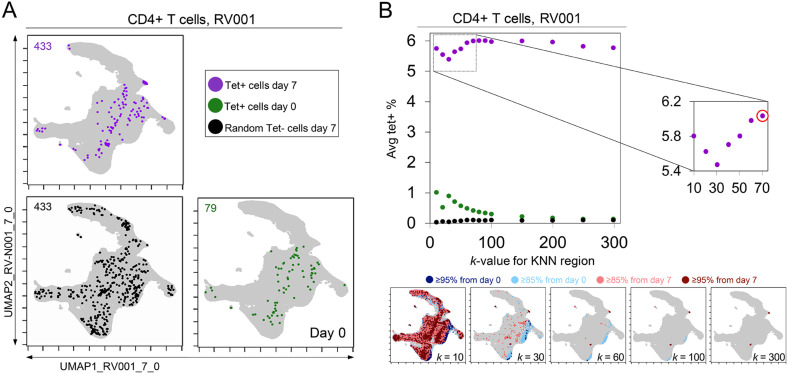
Figure 4. k-nearest neighbors (KNN) analysis around tetramer+ cells reveals an optimized k-value at the inflection point of the tetramer density curve.
(A) Tetramer+ cells from day 7 (dark purple) or from day 0 (light purple) and random tetramer- cells from day 7 (black) are shown overlaid on a common Uniform Manifold Approximation (UMAP) plot. The number of cells for each group is shown in the upper left of each plot. (B) Average tetramer enrichment is shown for increasing k-values in repeated KNN analysis of the cells. The inflection point of the resulting curve is circled in red at k = 70, which was the optimized k-value for KNN implemented as in Tracking Responders EXpanding (T-REX) for subject RV001. The T-REX plots on the UMAP axes are shown for various k-values.

