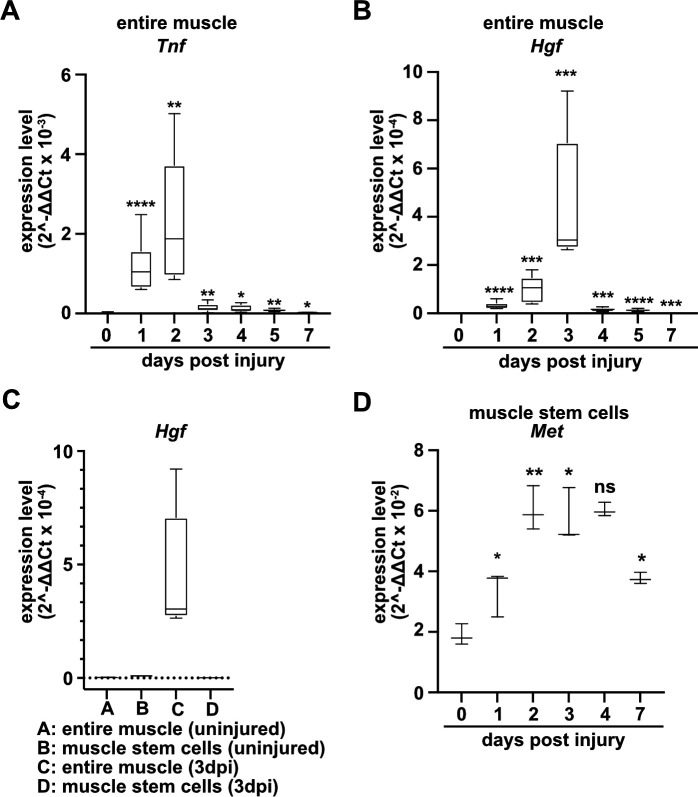
Figure 1. Expression of Tnf, Hgf, and Met during muscle regeneration.
(A, B) Expression dynamics of Tnf (A) and Hgf (B) in uninjured and regenerating muscle tissue determined by qPCR. (C) Expression dynamics of Hgf in quiescent and activated muscle stem cells and in muscle tissue during muscle regeneration determined by qPCR. (D) Expression levels of Met in quiescent and activated muscle stem cells determined by qPCR. Boxplots represent interquartile range, and whiskers show min-to-max range. β-Actin expression was used for normalization in (A–D).
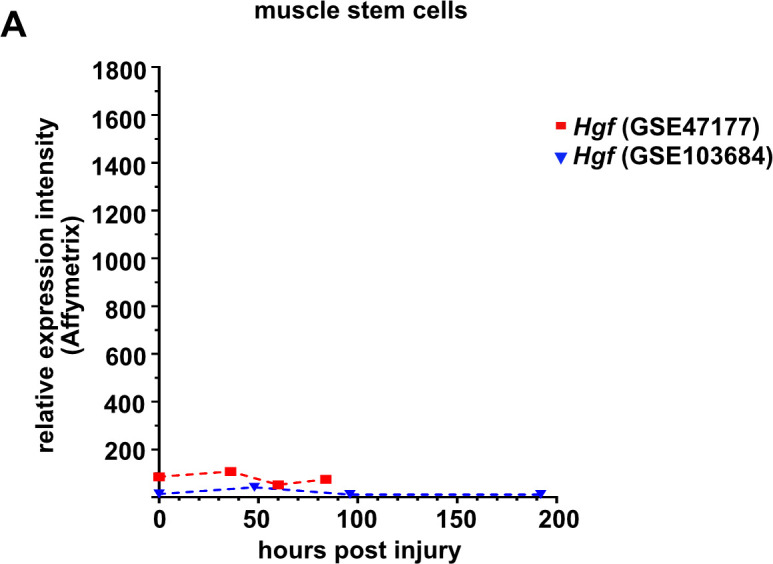
Figure 1—figure supplement 1. Expression levels of Hgf in quiescent (freshly isolated) and proliferating muscle stem cells at various time points defined by microarray analysis (Liu et al., 2013; Latroche et al., 2017).


