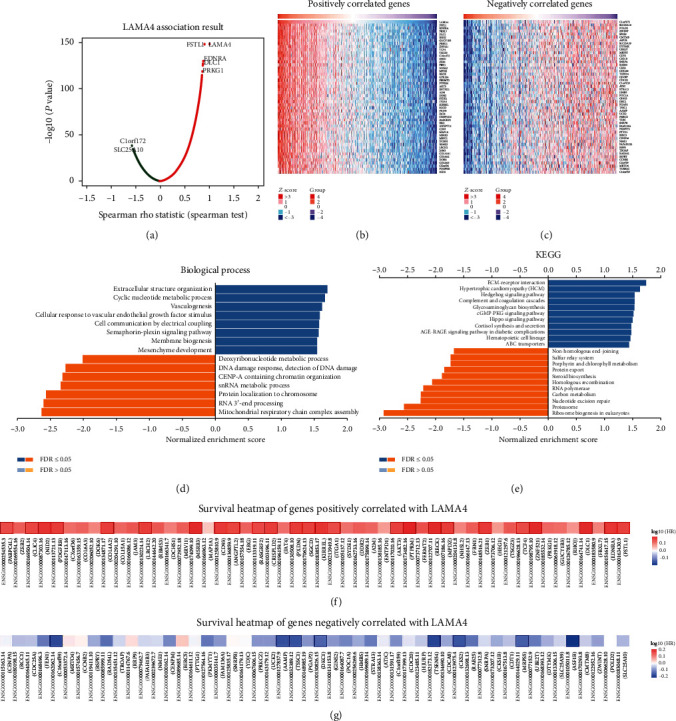
Figure 5.

Coexpression genes of LAMA4 in GC. (a) Volcano plot of genes highly correlated with LAMA4 identified by the Spearman test in GC. Red and green dots represent genes significantly positively and negatively correlated with LAMA4, respectively. (b, c) Heatmaps of the top 50 genes positively (b) and negatively (c) correlated with LAMA4. (d, e) Significantly enriched GO: biological process annotations and KEGG pathways of LAMA4. (f, g) Survival heatmaps of the top 50 genes positively (f) and negatively (g) correlated with LAMA4 using GEPIA. The survival heatmaps are presented in the form of a logarithmic scale (log10) of hazard ratios. The red and blue squares indicate higher and lower risks for survival, respectively. The bordered squares indicate the significant unfavorable and favorable survival (P < 0.05). GO: Gene Ontology; KEGG: Kyoto Encyclopedia of Genes and Genomes.
