


Figure 2.
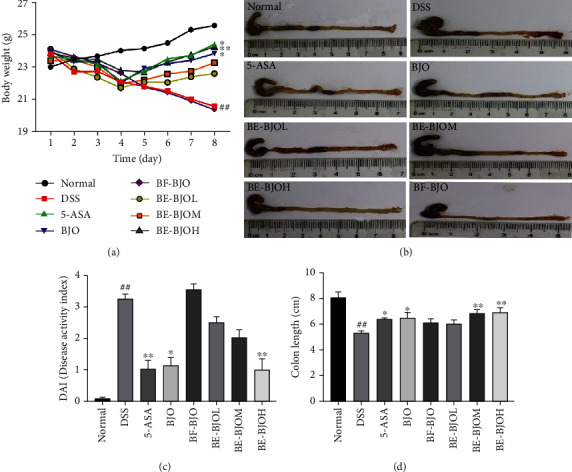
BE-BJO attenuated the severity of DSS-induced colitis in mice. Mice were monitored daily in terms of reductions of body weight (a), DAI score (b) in the DSS-induced UC mouse model. Representative photographs of colon length (c) and column chart of colon length (d). All values are presented as the mean ± SEM. ##P < 0.01 versus normal group; ∗P < 0.05, ∗∗P < 0.01, and ∗∗∗P < 0.001 versus DSS group.