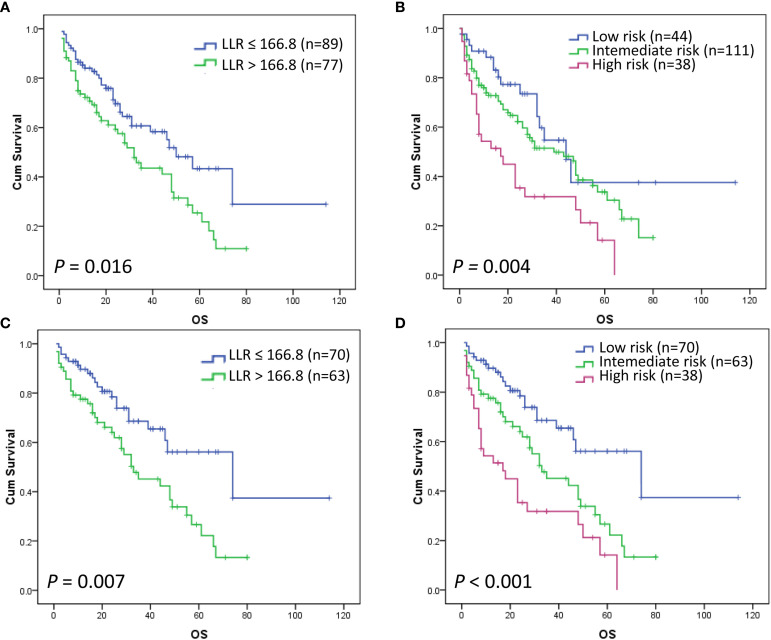
Figure 3.
Kaplan–Meier curves for OS according to the LLR (P = 0.016) (A) and MSKCC score (P = 0.004) (B). Overall survival Kaplan–Meier curves according to the LLR of low-intermediate MSKCC risk patients (P = 0.007) (C). Kaplan–Meier curves according to the novel PCNSL LLR scoring system (P < 0.001) (D).

