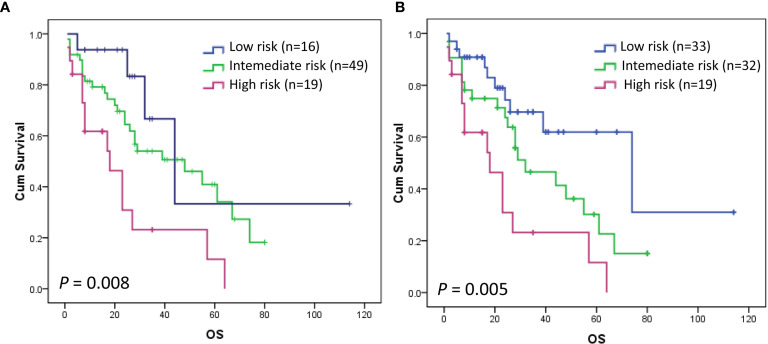
Figure 4.
Kaplan–Meier curve for OS according to the MSKCC scoring system (A) and PCNSL LLR scoring system (B) in the validation cohort. The OS rates of patients in the low-, intermediate-, and high-risk groups of the MSKCC scoring system were significantly different overall, with 5-year OS rates of 33.3% (n = 16) and 40.9% (n = 49), and 11.6% (n = 19), respectively (P = 0.008). MSKCC scoring system could not discriminate patients within low-, and intermediate- groups in the validation cohort (P = 0.243) (A). PCNSL LLR scoring system can clearly distinguish patients within the low-, intermediate-, and high-risk groups in the validation cohort (P = 0.005) (B).

