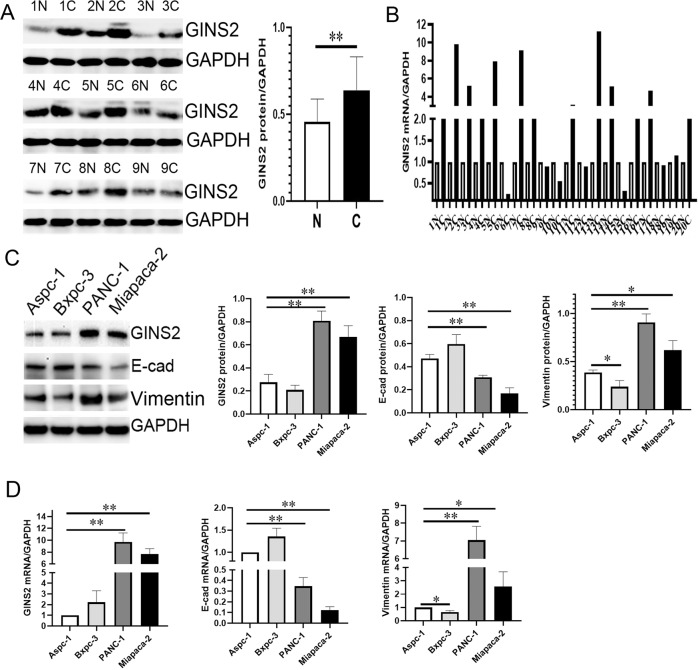
Fig. 3. The expression of GINS2, E-cad, and Vimentin in PC specimens and cell lines by WB and qRT-PCR.
a GINS2 protein level in 18 PC and paired pancreas (9 cases were shown here; N: paired pancreas; C: PC). b GINS2 mRNA level in 20 PC and paired pancreas (N: paired pancreas; C: PC). Paired-sample t-test was used for the data of a and b. c, d. GINS2, E-cad, and Vimentin protein (c) and mRNA (d) levels in PC cells. Bars indicate ± SE. *P < 0.05; **P < 0.01 compared with the control.

