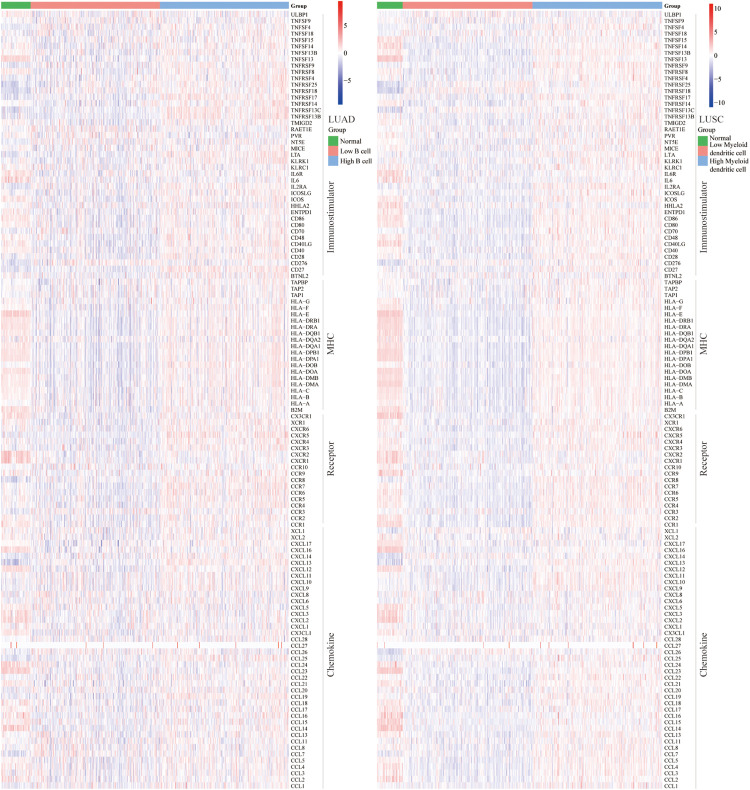
FIGURE 5.
Heatmaps of immunomodulators (immunostimulators, MHC, receptors, and chemokines). Most immunomodulators were upregulated in the high-infiltration group. Each column represents a sample, and each row represents one of the immunomodulators. The expression level of immunomodulators was displayed in different colors, transitioning from blue to red with increasing expression.

