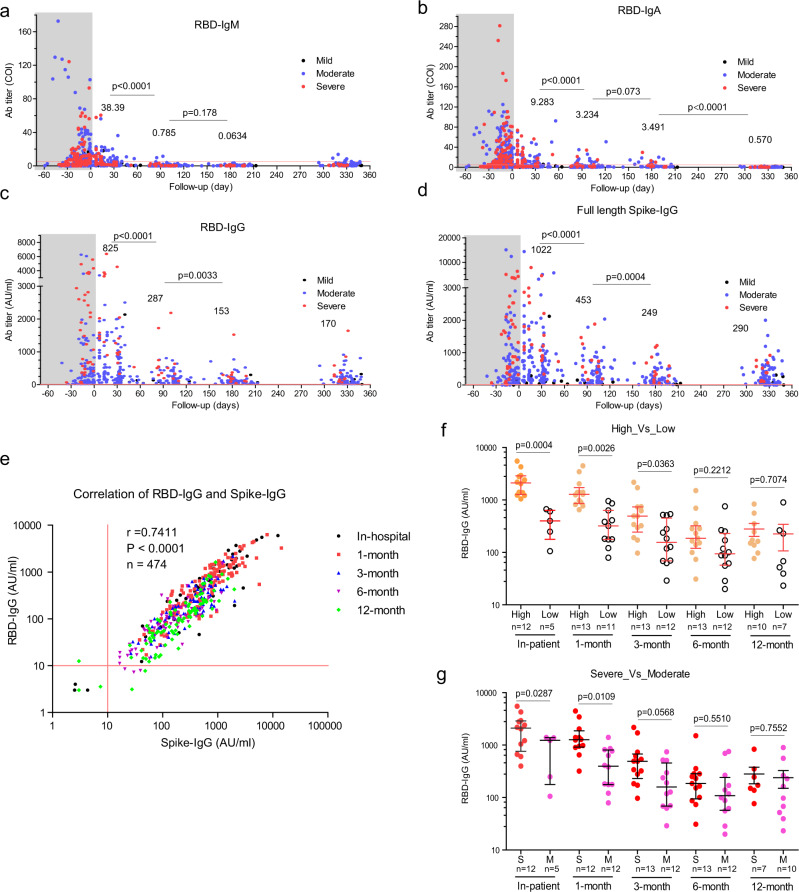
Fig. 1. Kinetics of SARS-CoV-2 viral-specific antibodies up to 1 year.
SARS-CoV-2 infected individuals who attended the follow-up program were included in this analysis. a–c RBD-IgM, IgA, and IgG changes since symptom on-set. x-axis, follow-up time (day). y-axis, antibody titer (COI cut-off index; or arbitrary unit, AU/ml). The shaded regions represent the in-patient stage. The average values in the 1-month, 3-month, 6-month, and 12-month stages were labeled. P values (two-tailed) were shown. Mild (black dots), moderate (blue dots), and severe (red dots) symptoms. d Full-length spike-IgG changes since symptom on-set. x-axis, follow-up time (day). y-axis, antibody titer (AU/ml). e Correlation of RBD-IgG and Spike-IgG. In-hospital stage (black), 1-month follow-up (red), 3-month follow-up (blue), 6-month follow-up (purple), 12-month follow-up (green). Pearson r number and p value (two-tailed) were shown. f Longitudinal analysis of RBD-specific IgG between patients with high titer (RBD-IgG >1000 AU/ml, orange circle) and patients with low titer (RBD-IgG <1000 AU/ml, empty circle). g Longitudinal analysis of RBD-specific IgG between severe patients (red circle) and moderate patients (pink circle). Lines in x-axis and y-axis in a–e indicate the cut-off values. a–d, Mean values were labeled for each column. f, g, Data were presented as median with interquartile range. An unpaired t-test with Welch’s correction analysis was applied, and p values (two-tailed) were labeled. Source data are provided as a Source Data file.

