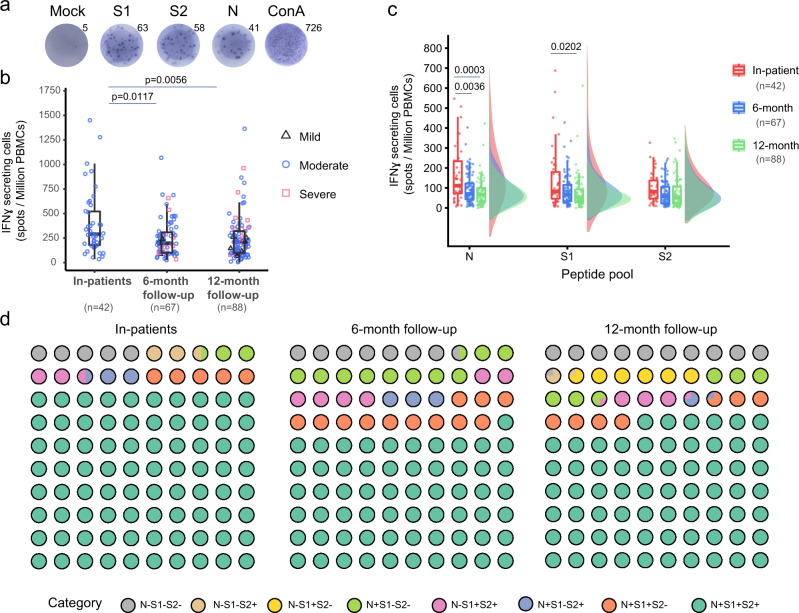
Fig. 3. SARS-CoV-2 specific T cells response in recovered COVID-19 patients.
a Representative ELISpot well images displaying IFNγ-secreting cells. N, S1, and S2, Synthetic overlapping peptide pool of nucleocapsid (N), Spike 1 subunit (S1), and 2 (S2). Con A, Concanavalin A positive control. b Spot numbers of IFNγ-secreting cells indicating the reduction in SARS-CoV-2 specific immune response over time. The numbers are the sum of N, S1, S2-stimulated wells. Data were presented as median with interquartile range. c Raincloud plots show different T cellular response levels among three peptide pools at different time points of follow-up. d Waffle dot plot showing composition percentage of the SARS-CoV-2 response during 1-year follow-up. Statistics by Mann–Whitney U-test. P value (two-tailed) were shown. b, c Data were represented as box-and-whisker plots (median with interquartile, upper-limit, and lower-limit). Source data are provided as a Source Data file.

