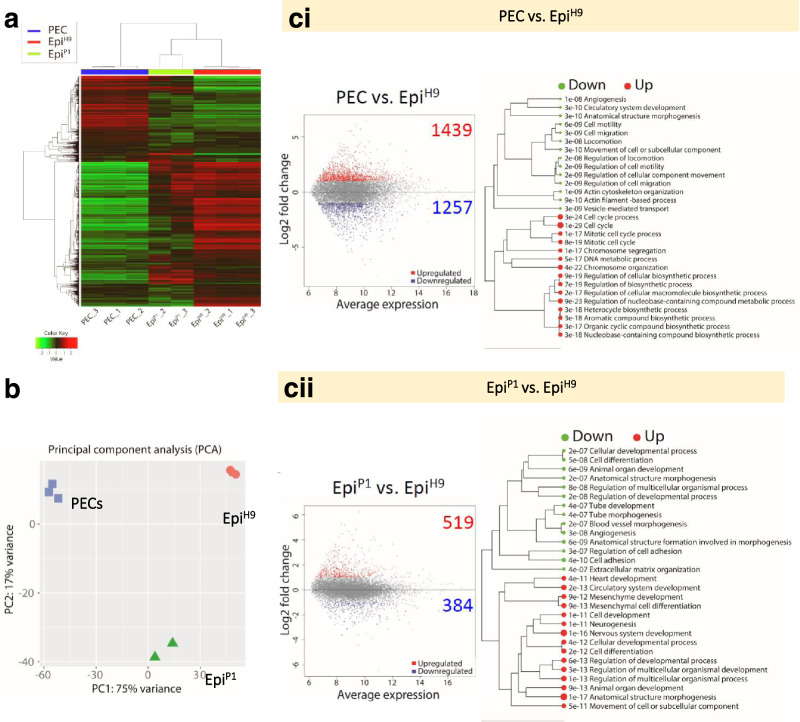
Fig. 2. RNA Sequencing analysis and functional interpretation.
a Unsupervised hierarchical clustering of 2,000 most variable genes based on correlation distance (average linkage) method. Replicates for each group were from independent differentiation batches. b Principal component analysis (PCA) cluster PECs closer to EpiP1 as compared to EpiH9. c MA plots of differential expression analysis for PEC vs EpiH9 (i) and EpiP1 vs EpiH9 (ii) comparisons. Differentially expressed genes (DEGs) are highlighted as red dots for upregulation and blue dots for downregulation (adjusted p value < 0.05 and absolute fold change ≥ 2). Functional clustering of gene ontology terms for biological processes for both up and downregulated DEGs for PEC vs EpiH9 and EpiP1 vs EpiH9 comparisons. DEGs were determined using DeSeq2 and analyzed using the Wald test with Benjamini-Hochberg multiple comparison corrections. FDR value = 0.05 was used as to determine the statistical significance.

