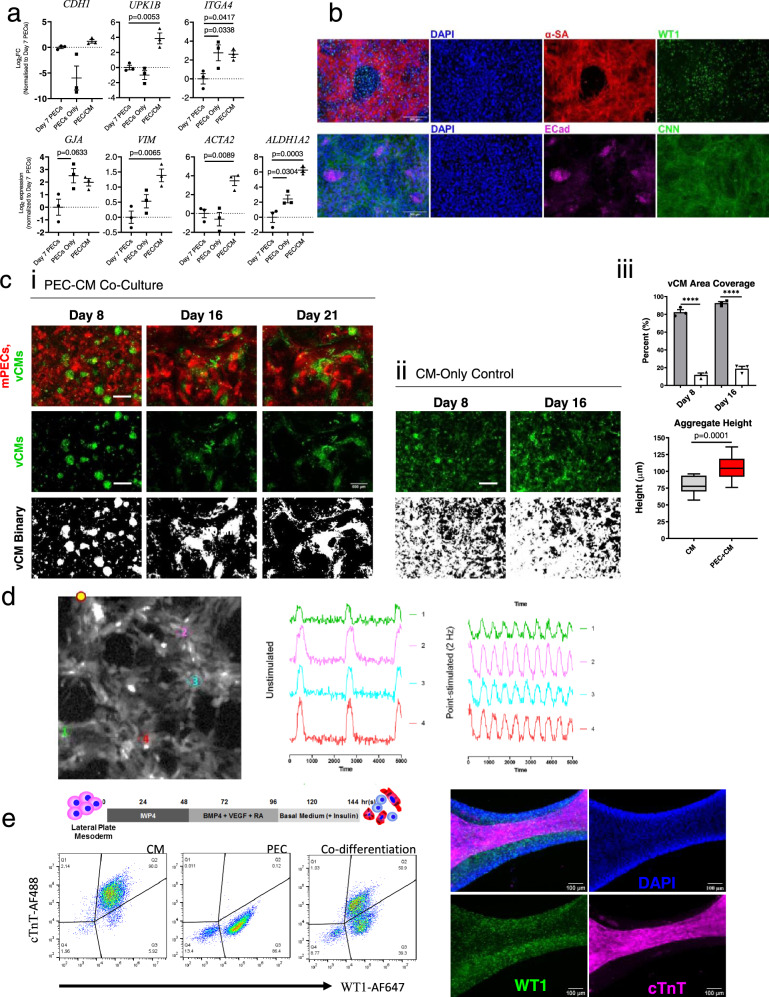
Fig. 4. PEC fate in CM co-culture and its effect on CM.
a The log2 fold change of PECs alone and fluorescence-sorted mCherry-tagged PECs from CM co-culture were compared to the expression level in PECs at day 7, analyzed by RT-PCR. Data presented in mean ± SEM from three independent experiments (n = 3). Statistical significance versus day 7 PECs was determined using one-away ANOVA with Dunnett post hoc test. b Representative images of immunofluorescence-staining from three independent experiments confirm the presence of WT1+ (green) cells (Top) along with α-sarcomeric actinin+ CM (Red) in co-culture. ECAD+ (magenta) epithelial cells and CNN+ (Green) smooth muscle cells were also formed in CM co-culture (bottom). Scale bar = 200 µm. c Venus-CM surface area coverage and aggregate formation in (i) PEC-CM co-culture compared to (ii) CM-only controls over time in culture, with (iii) quantification of cell coverage and aggregate height. Scale, 500 µm. Cell coverage measurements were taken from broad-field areas (7.6 mm2) from three independent experiments. Two-tailed student t-test was used for both coverage (bar) and height (box plot) analyses; Data presented in box and whiskers plots represent the maxima, 75th percentile, median, 25th percentile and minima. Aggregate height measurements were taken from n = 15 areas from three independent experiments; Data presented as mean ± SEM. ****p values < 0.0001. d Representative calcium-signaling traces (using Fluo-3AM) recorded at Day 14 from a broad PEC-CM co-cultured area under (i) unpaced and (ii) paced conditions via point-stimulation (yellow dot; Scale, 100 µm), demonstrating network connectivity at points 1–4, from three independent experiments. e Schematic shows timeline for PEC/CM co-differentiation from LPM. Dotplot presents the proportion of WT1+ cells, cTnT+ cells, and double-negative cells in co-differentiation culture (n = 1), analyzed by flow cytometry. Immunofluorescence images of co-differentiation culture show representations of spontaneous spatial organization of PECs and CMs in a ‘tube’ like structure from three independent experiments.

