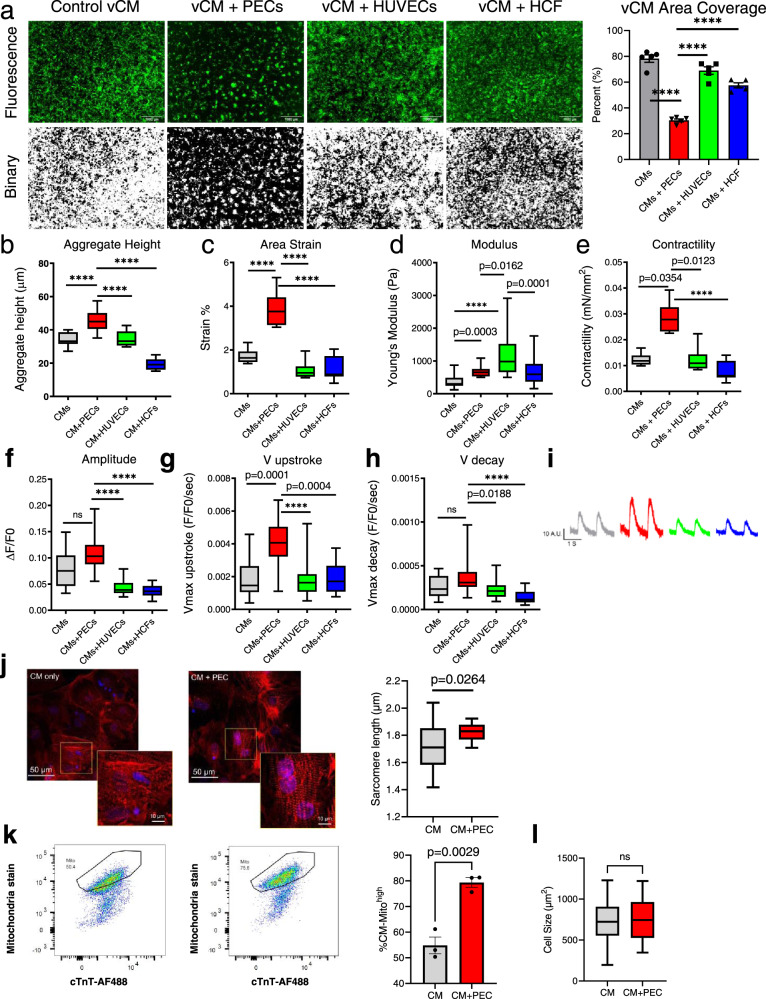
Fig. 5. Effects of PECs on 2D CM co-culture.
a Representative fluorescence and binary images from five independent replicates of vCMs alone and co-cultured with either HUVECs, human cardiac fibroblasts (HCFs), or PECs after 8 days. (Right) vCM surface area coverage in co-culture with HUVECs, HCFs, and PECs compared to CM-only controls after 8 days. Scale, 500 µm. Cell coverage measurements at 8 days were taken from broad-field areas (7.6 mm2, N = 5 for each group); Data presented as mean ± SEM and analyzed by using one-way ANOVA with Dunnett post hoc test versus PEC/CMs only. ***p value < 0.0001. b Two-dimensional aggregate height analysis of all CM culture groups (CMs-alone, PEC-CMs, HUVEC-CMs, HCF-CMs) at day 8 of culture. N = 15 aggregates examined over three independent experiments. Data are presented in box and whiskers plot, with lines indicate 25th, 50th, and 75th percentiles and minima and maxima. One-way ANOVA with Dunnett post hoc test versus PEC/CMs was used. ****p value < 0.0001. c Cardiomyocyte contractility metrics. Area strain of cardiomyocytes from different experimental groups, determined using high-speed HDM imaging analysis, with n = 7 areas per CM group, three contractions analyzed per area examined over three independent replicates. Data are presented in box and whiskers plot, with box lines indicating 25th, 50th, and 75th percentiles, and whisker lines indicating minima and maxima. One-way ANOVA with Dunnett post hoc test versus PEC/CMs was used. ****p value < 0.0001. d Young’s modulus of cell-seeded gels from different experimental groups, determined by atomic force microscopy. Data were analyzed from n = 41, 29, 48, and 47 areas of CMs only, CM + PECs, CM + HUVECs and CMs + HCF, respectively examined over three independent replicates. e Day 14 contractility (force/area) of CMs cultured alone or in co-culture with PECs, HUVECs, or HCFs (n=7). f-i Day 14 Fluo-3AM calcium-signaling analysis of CMs cultured alone or in co-culture with PECs, HUVECs, or HCFs for amplitude (f), maximal velocity of calcium transient upstroke (g), and maximal velocity of calcium transient decay (h). Representative calcium traces are depicted for comparison (i). (n = 15 for each group, across all calcium transient metrics); d–i Data are presented in box and whiskers plot, with box lines indicating 25th, 50th, and 75th percentiles, and whisker lines indicating minima and maxima. Statistical significance at p < 0.05 was determined using Kruskal–Wallis with Dunn’s multiple comparison tests. ****p value < 0.0001. j Representative images of α-Sarcomeric actinin-stained CM in and PEC co-culture (red = α-actinin, blue = DAPI). Sarcomere length was measured manually from a total of 30 sarcomeres of three control CMs and 30 sarcomeres of three PEC co-cultured CMs derived from three independent biological replicates. The line presented in the boxplot is 25th, 50th, and 75th percentiles and minima and maxima. Comparison between CM alone vs PEC/CM were analyzed using a two-tailed T-test with Welch’s correction. k Representative FACS analysis of mitochondria stained CMs in control (left) and PEC co-culture (right). Bar graph showed the percent of CMs with high mitochondria density (% CM-Mitohigh). A two-tailed student t-test was used (n = 3, p < 0.002). l CM size analysis comparing CM (n = 129) vs PEC/CM (n = 115). The line presented in the boxplot is 25th, 50th, and 75th percentiles and standard deviation. Comparison between CM alone vs PEC/CM were analyzed using a two-tailed T-test with Welch’s correction.

