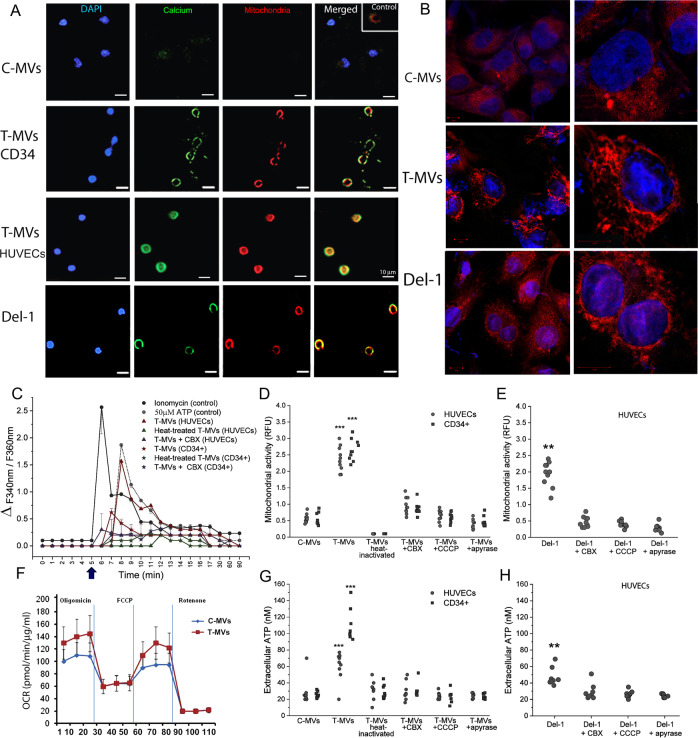
Fig. 4. T-MVs increase cytosolic calcium, mitochondrial activity, and ATP release.
A Representative confocal images of HUVECs and CD34+ cells stimulated by 6 μg/ml C-MVs or T-MVs, or by 1μM Del-1. After 10 min of stimulation, cells were stained for nuclei, mitochondria (Mitotracker red), and calcium (Fluo4-2AM green). Scale bar = 10 μm. B Image of HUVECs mitochondria stained with red mitotracker after 10 min of stimulation with C-MVs, T-MVs, or Del-1, showing progressive accumulation of mitochondria on the cell membrane and changes in their morphology. Scale bar = 10 μm objective ×40 and right zoom (×2). C Representative time-course of T-MVs induced changes in intracellular Ca2+, expressed as differential fluorescence (between C-MVs and stimuli) measured as ratio (F340/F380). HUVECs and CD34+ cells were incubated with 30 ng/ml Ionomycin or ATP 50 μM (positive controls), or stimulated with 6 μg/ml of T-MVs, heat-inactivated T-MVs) in the absence or presence of 50 μM CBX, a specific mitochondrial inhibitor. After 5 min of stimulation in Ca2+-free solution, 2.5 mM Calcium was added (indicated by arrow). Nonspecific Ca2+ entry was subtracted. Data are mean ± SEM of seven independent experiments per stimulus. D Mitochondrial activity (determined as averages of relative fluorescence intensity of MitoTracker (CM-H2XRos) in HUVECs and CD34+ cells stimulated for 5 min with C-MVs, T-MVs, heat-inactivated T-MVs, or T-MVs with inhibitors CBX (50 μM), CCCP (10 μM), or apyrase (20 U/ml). E Mitochondria relative fluorescence unit in HUVECs stimulated with Del-1 without or with CBX, CCCP, or apyrase. Data are mean ± SEM of three independent experiments. Significances were calculated by one-way ANOVA. **P < 0.05; ***P < 0.001 vs. all other groups. F Seahorse profile for oxygen-consuming rate (OCR) (normalized for concentration of protein reported as μg/ml) of HUVECs stimulated by T-MVs or C-MVs for 1 min. For a full description of the assay and its use to assess mitochondrial respiration see Supplementary Fig. 6. G Extracellular ATP in HUVECs and CD34+ cells stimulated for 1 min with C-MVs, T-MVs, heat-inactivated T-MVs, or T-MVs with inhibitors CBX (50 μM), CCCP (10 μM), or apyrase (20 U/ml). H Extracellular ATP in HUVECs stimulated with Del-1 without or with CBX, CCCP, or apyrase (the inhibitors were added 30 min before to start the test). Data are mean ± SEM of three independent experiments. Significances were calculated by one-way ANOVA. **P < 0.05; ***P < 0.001 vs. all other groups.

