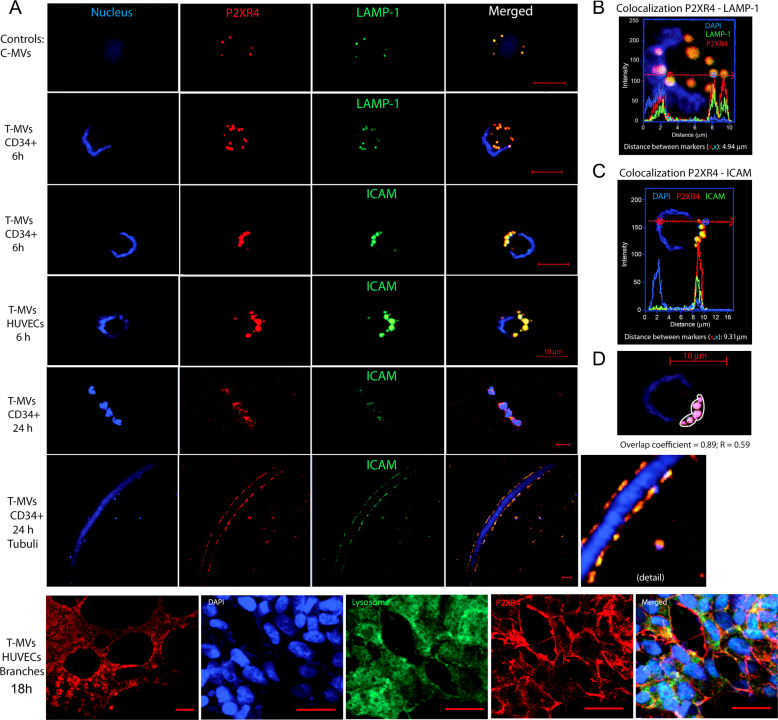
Fig. 5. T-MVs increase P2XR4 expression.
A Representative confocal fluorescence images using specific antibodies to show localization of P2XR4 (red), LAMP-1 (green) or the membrane marker ICAM (green), and nuclei (DAPI, blue) in both HUVECs and CD34 incubated for different times with C-MVs or T-MVs, as indicated. In both cell types, P2XR4 colocalizing with LAMP-1 then shifts toward the cell membrane, as indicated by P2XR4 colocalization with ICAM-1 after 6 h (scale bar = 10 μm). After 24 h CD34 cells appear elongated and aligned in a tubule-like structure positive for both P2XR4 and ICAM-1 (scale bar 10 μm). At 18 h HUVECs incubated with T-MVs on matrigel formed branches (scale bar 100 μm); nuclei stained with DAPI (blue) lysosome (green) P2XR4- (red) and ovelay. Scale bars = 10 μm. B Higher magnification of CD34+ cell merged image after 6 h incubation with T-MVs showing P2XR4 and LAMP-1 fluorescence intensity histogram along the cell plane indicated by the red arrow. C Higher magnification of HUVEC cell merged image after 6 h incubation with T-MVs showing colocalization between P2XR4 and ICAM-1 fluorescence intensity peaks almost exclusively on the cell membrane, at distance from the nucleus (DAPI blue). D Detail of overlap fluorescence staining (red P2XR4 and green ICAM). In the outlined area of this cell, Pearson’s overlap coefficient was 0.89 (R = 0.59). Data are mean ± SD of six experiments and a total of 55 cells.

