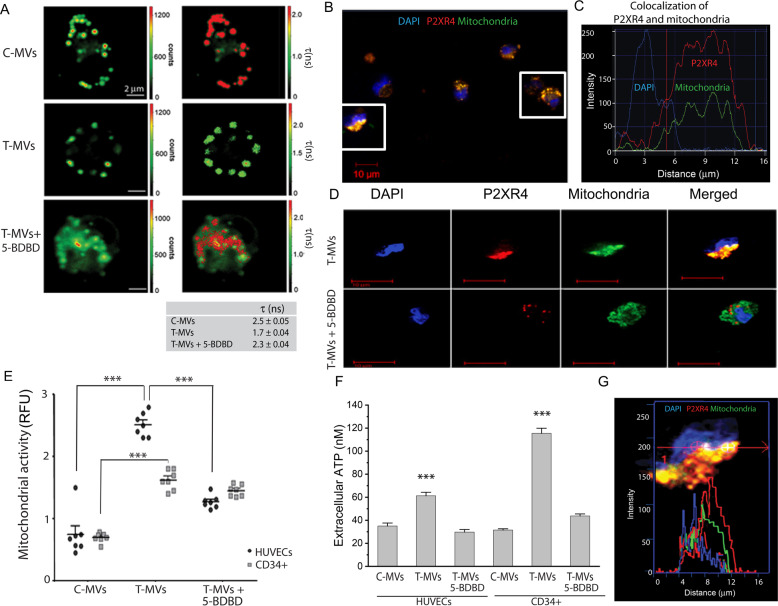
Fig. 6. Vesicular trafficking of P2XR4 affects membrane viscosity.
A Fluorescence Lifetime Imaging Microscopy (FLIM) evaluating fluorescence intensity (left images) and average fluorescence lifetime (right images) in single-cell stained with 5 μM BODIPY FL C12 for 20 min following specific stimuli, as indicated. Scale bars = 2 µm. Mean of τ values (in nanoseconds) calculated from the green to red pseudo-color scales directly relate to membrane viscosity, and are reported as mean ± SEM of three independent measurements of n = 20 cells for each plate. B Representative images of HUVECs stimulated with T-MVs, overlay of mitochondria (green) and P2XR4 antibody (red). Scale bar = 10 μm (20× objective). C Example of typical fluorescence intensity histogram showing DAPI (nuclei, blue) P2XR4 (red) and mitochondria (green) staining. D Representative images of HUVEC cell stimulated with T-MVs, or T-MVs with the P2XR4 inhibitor 5-BDBD (5 μM), stained for mitochondria (green) and P2XR4 antibody (red) and merged. Scale bar = 10 μm (60× objective). E Relative fluorescence intensity of MitoXRos staining (CM-H2XRos) in HUVECs and CD34+ cells treated with C-MVs, T-MVs, or T-MVs + 5-BDBD. F Extracellular luciferase ATP dosage in CD34 cells and HUVECs after 1 min of stimulation with C-MVs or T-MVs without or with 5-BDBD (5 μM). Data are mean ± SEM of three independent experiments. Significances were calculated by one-way ANOVA. ***P < 0.001 vs. control and T-MVs + 5-BDBD. G Fluorescence intensity peaks of P2XR4 and Mitochondria staining along the diameter of HUVEC cell stimulated with T-MVs (merged panel D).

