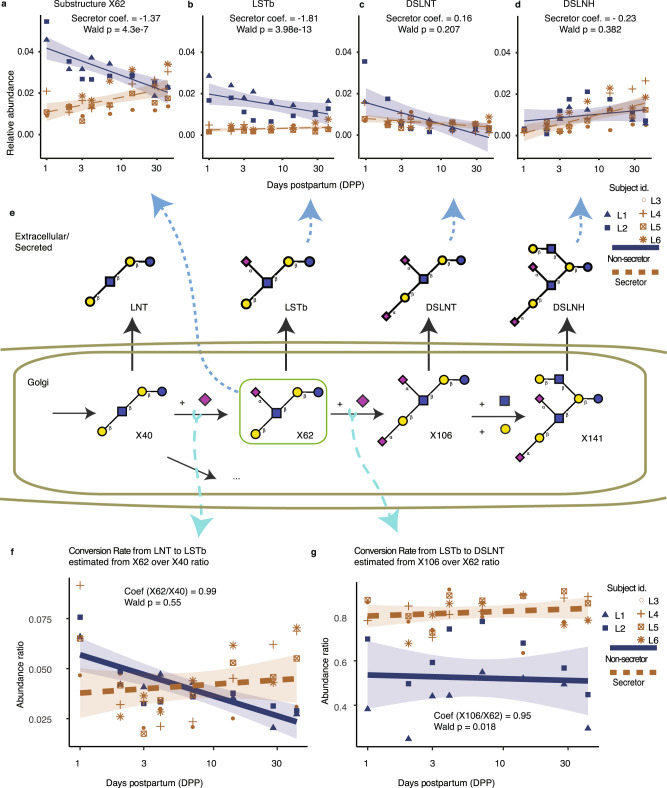
Fig. 5. Analysis of intermediate substructures with GlyCompare elucidates unexpected associations in HMO abundance and reaction flux with secretor status, which are missed in the standard whole-glycan analysis.
a–d Over time (DPP), substructure X62, LSTb, DSLNT, and DSLNH show different trends for secretors and non-secretors. Furthermore, the abundance of aggregated X62 shows significant positive-correlation with secretor and negative-correlation with non-secretor. GEE models for each structure are visualized and approximated using a gaussian-link generalized linear model with 95% confidence intervals; odds ratio (OR) significance (likelihood OR is non-zero) was measured with a two-sided Wald test (a n = 47, Coef = −1.37, p = 4.3e−7; b n = 47, Coef = −1.81, p = 3.98e–13; c n = 47, Coef = 0.16, p = 3.98e–13; d n = 47, Coef = 0.382, p = −0.23). e The substructure intermediates for four connected glycans are shown here. The synthesis of larger glycans must pass through intermediate substructures that are also observed glycans, where the substructures are as associated with measured glycans as follow X40 = LNT, X62 = LSTb, X106 = DSLNT, X138 = DSLNH. f, g Panels examine the product-substrate ratio for two reactions in panel (e). X40, the LNT substructure, is a precursor to X62, the LSTb substructure, which is a precursor to X106, the DSLNT substructure. We estimate the flux of these conversions from X40 to X62 and X62 to X106 by examining the product-substrate ratio, i.e., the proportion of the total synthesized substrate converted to the product. LSTb/LNT substructure relative abundance ratios are not associated with secretor status while DSLNT/LSTb ratios are. Panels f and g show OR corresponding to the ratio association with secretor status (f n = 47, OR = 0.99, p = 0.55; g n = 47, OR = 0.95, p = 0.018). See Supplementary Table 3 for complete GEE statistics. Source data are provided as a Source data file.

