Figure 2.

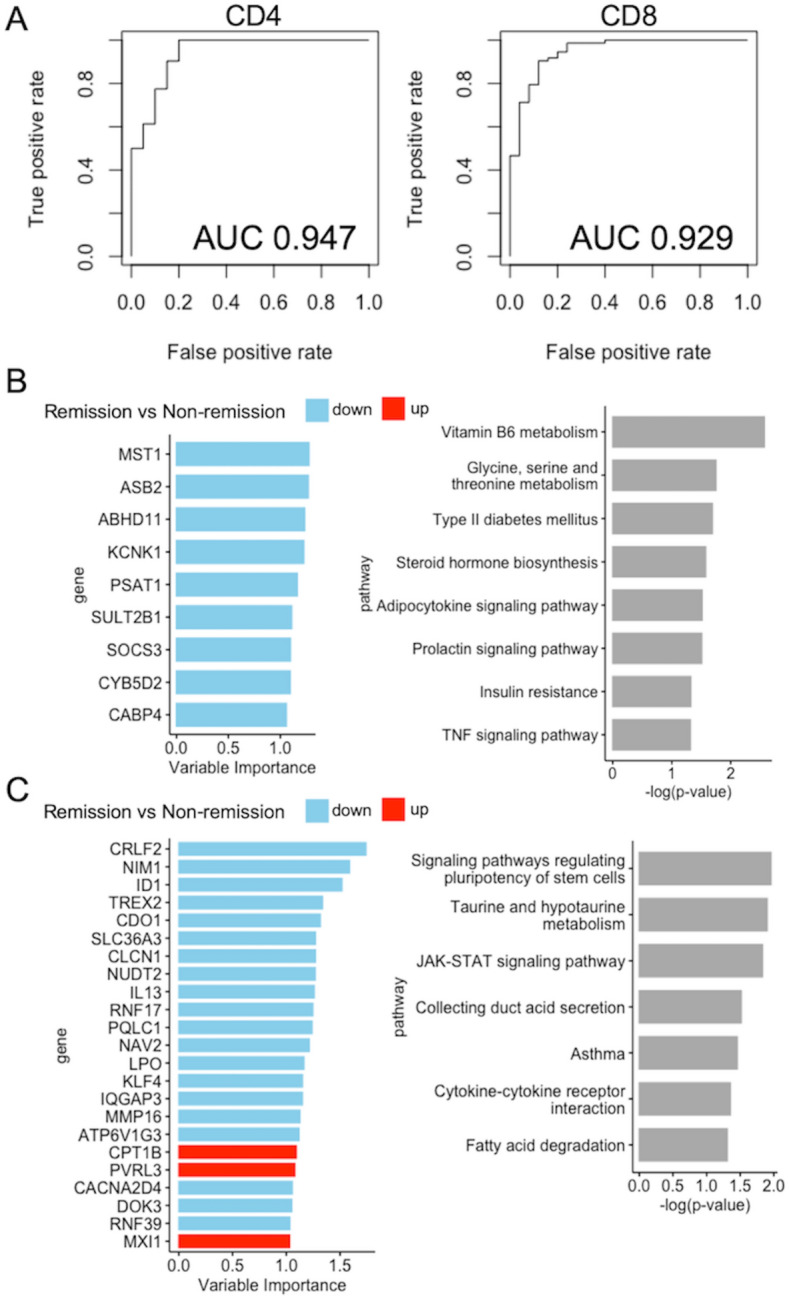
Identification of molecular signatures associated with remission in RA. (A) ROC analysis according to the statistical model generated by the combination of lasso and PLS-R. (B) and (C) Remission signature genes (left) and enrichment analysis (right) of CD4+ T cells and CD8+ T cells (B). The PLS-R analysis of gene expression, with blue indicating low and red toward high expression in remission patients. AUC, area under the curve; PLS-R, a partial least-squares regression; RA, rheumatoid arthritis; ROC, receiver operating characteristic.
