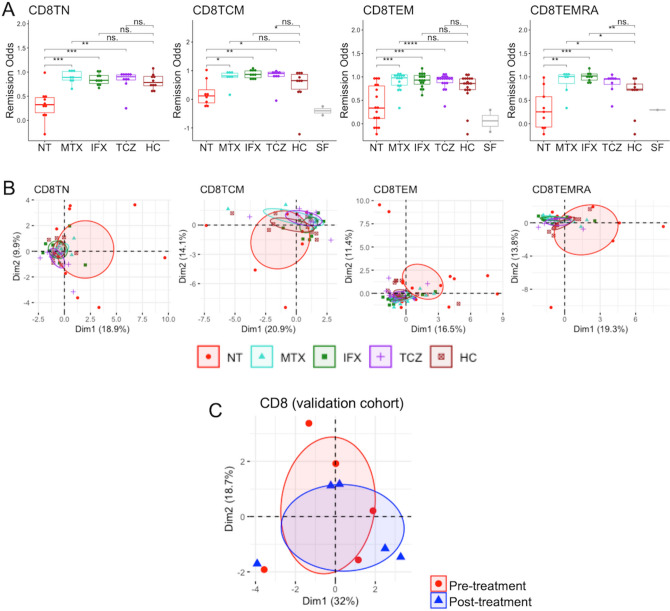
Figure 4.
Remission odds and gene expression profiling of remission signature genes in CD8+ T cells. (A) Remission odds generated by the RA remission model. ‘*’: p < 0.05, ‘**’: p < 0.01, ‘***’: p < 0.001, ‘****’: p < 0.0001. (B) and (C) Primary component analysis using remission signature genes in the derivation cohort (B) and the validation cohort (C). The ellipse shows the 95% confidence interval of the value of principal component analysis. Patients in the validation cohort were treated by TCZ for 6 months and achieved remission after treatment. HC, healthy control; IFX, infliximab; MTX, methotrexate; RA, rheumatoid arthritis; NT, non-treatment; SF, synovial fluid; TCM, central memory T cell; TCZ, tocilizumab; TEM, effector memory T cell; TEMRA, CD45RA-positive effector memory T cell; TN, naïve T cell.

