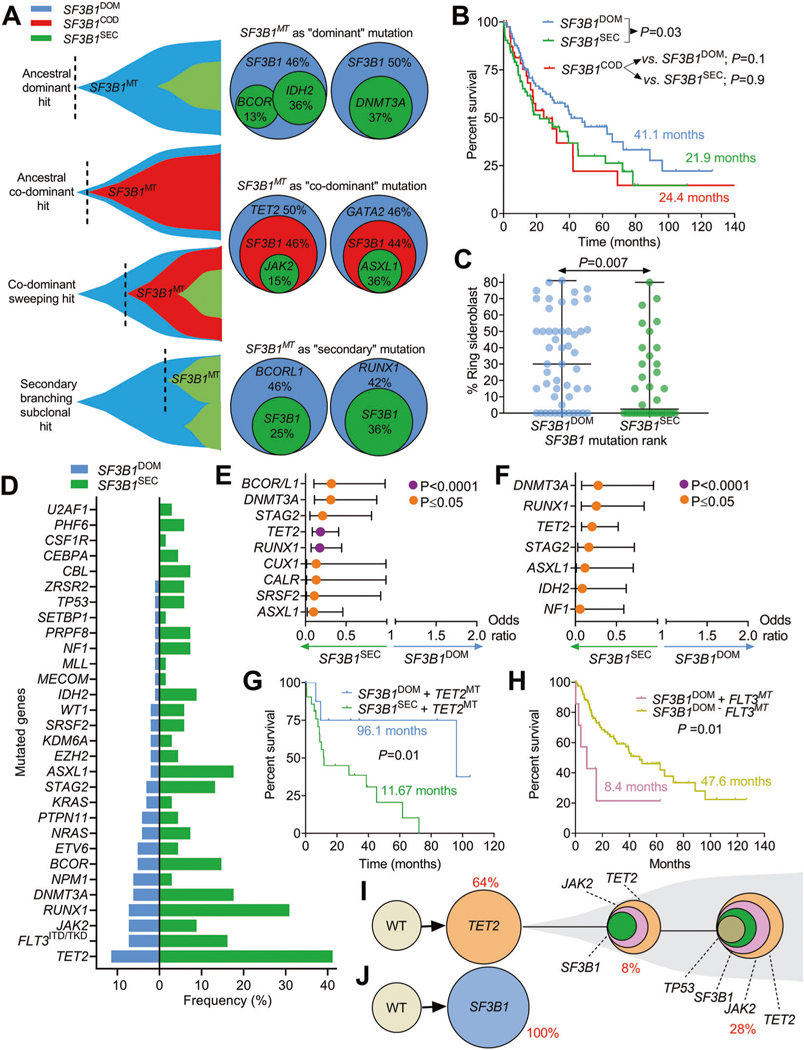
Fig. 1. Characteristics, mutational associations and prognostic implications of clonal events in SF3B1 mutant myeloid neoplasms.
A Fish plots and pie charts depicting different examples of SF3B1 mutations clonal status and its secondary mutations in the case of SF3B1 dominant (SF3B1DOM), SF3B1 co-dominant (SF3B1COD) and SF3B1 secondary mutations (SF3B1SEC). B Kaplan–Meier curves showing the overall survival of cases with SF3B1 mutations per clonal status (dominant, secondary, co-dominant). The curves represent the percent survival of patients with dominant, co-dominant and secondary SF3B1 mutations. Comparisons of survival in dominant versus secondary SF3B1 and co-dominant versus dominant and secondary were done. Levels of statistical significance was calculated by P values. C Scatter plot describing the percentage of ringed sideroblasts in patients with SF3B1 dominant (blue) vs. secondary (green) mutations. Levels of statistical significance was assessed by P values using Mann–Whitney U test. D Bar graph showing the frequency (in percentage) of a panel of myeloid gene mutations co-occurring with SF3B1 mutations in dominant vs. secondary status. E Univariate analysis showing the odds ratio representing the strength of the association of SF3B1 mutations with other gene mutations. Levels of statistical significance is indicated in purple and orange colors (P < 0.0001 and P≤ 0.05) using Fisher’s Exact test. F Multivariate analysis showing the odds ratio representing the strength of the association of SF3B1 mutations with other gene mutations. Levels of statistical significance is indicated in purple and orange colors (P < 0.0001 and P≤ 0.05) using Fisher’s Exact test. G Kaplan–Meier curves showing the impact of TET2 mutations (TET2MT) on SF3B1 mutant cases per hierarchical SF3B1 mutational configuration: SF3B1 dominant (SF3B1DOM) vs. secondary (SF3B1SEC). Levels of statistical significance was calculated by P values. H Kaplan–Meier curves showing the impact of the presence of FLT3 mutations (FLT3MT) on SF3B1 dominant (SF3B1DOM) cases. Levels of statistical significance was calculated by P values. Single cell-DNA sequencing revealing the clonal trajectories of one sample with (J) ancestral/founder SF3B1 mutation and another sample with secondary/subclonal SF3B1 mutation (I). Different colors represent different mutations.

