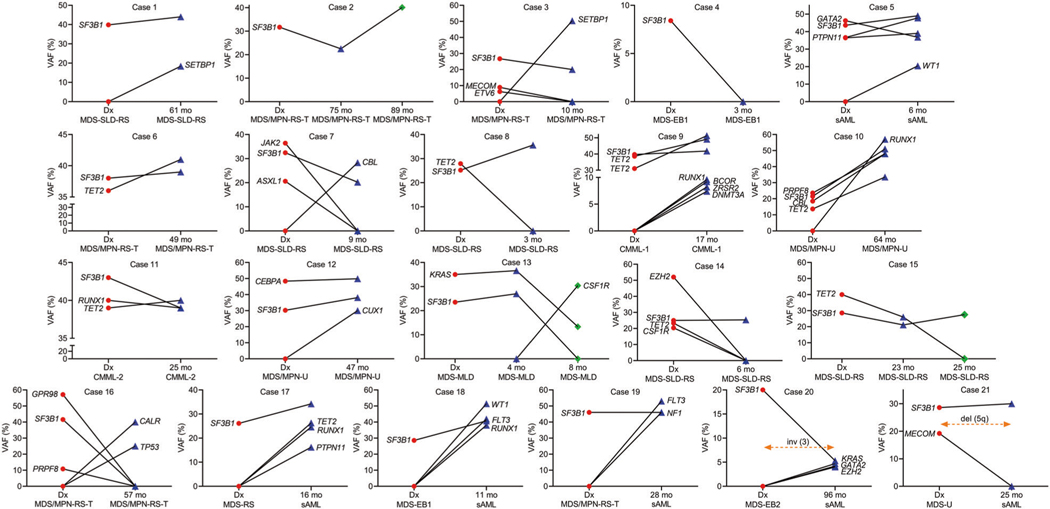
Fig. 2. The clonal trajectories of SF3B1 mutations.
Serial analysis of patients with myeloid neoplasia and SF3B1 mutations. DNA specimens from 21 samples with SF3B1 mutations were analyzed at 2 or 3 time points. Targeted sequencing panel for myeloid genes was applied to all samples. Line graphs indicate variant allele frequency in percentage for mutations considered somatic. Red, blue and green colors indicate mutations at first time point, second and third time point, respectively. Dx diagnosis, VAF variant allele frequency, mo months.

