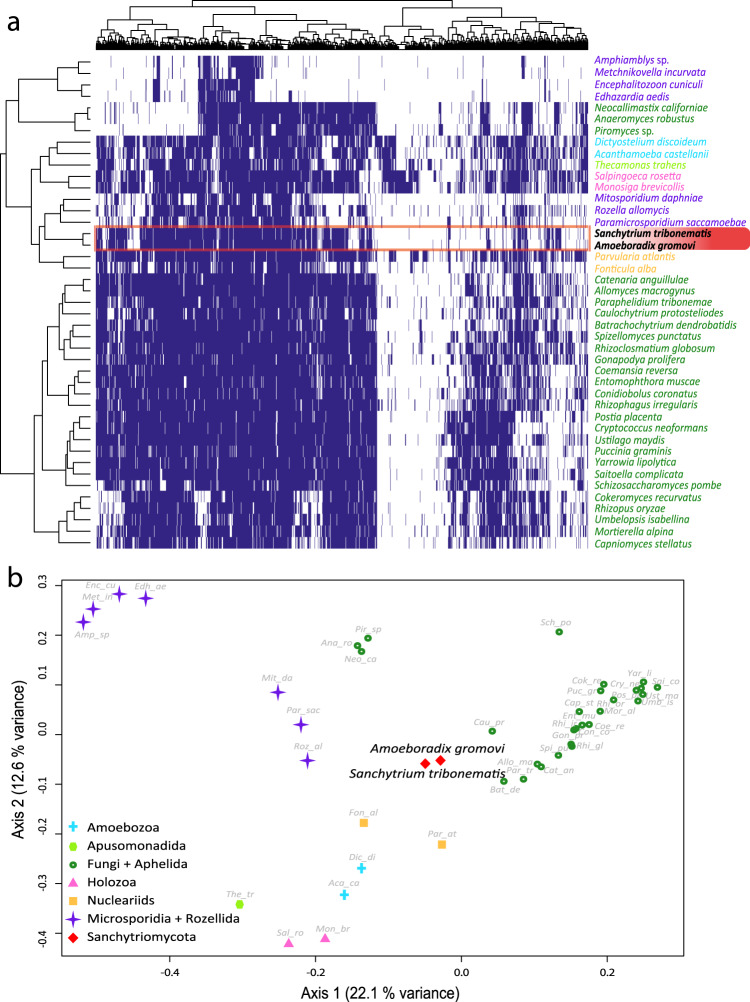
Fig. 3. Distribution patterns of primary metabolism genes in Holomycota.
a Binary heatmap and b principal coordinate analysis (PCoA) species clustering based on the presence/absence of 1158 orthologous genes belonging to eight primary metabolism Gene Ontology categories across 43 eukaryotic genomes and transcriptomes. Species are colour- and shaped-coded according to their taxonomic affiliation as indicated in the legend. COG presence is depicted in blue and absence is depicted in white.

