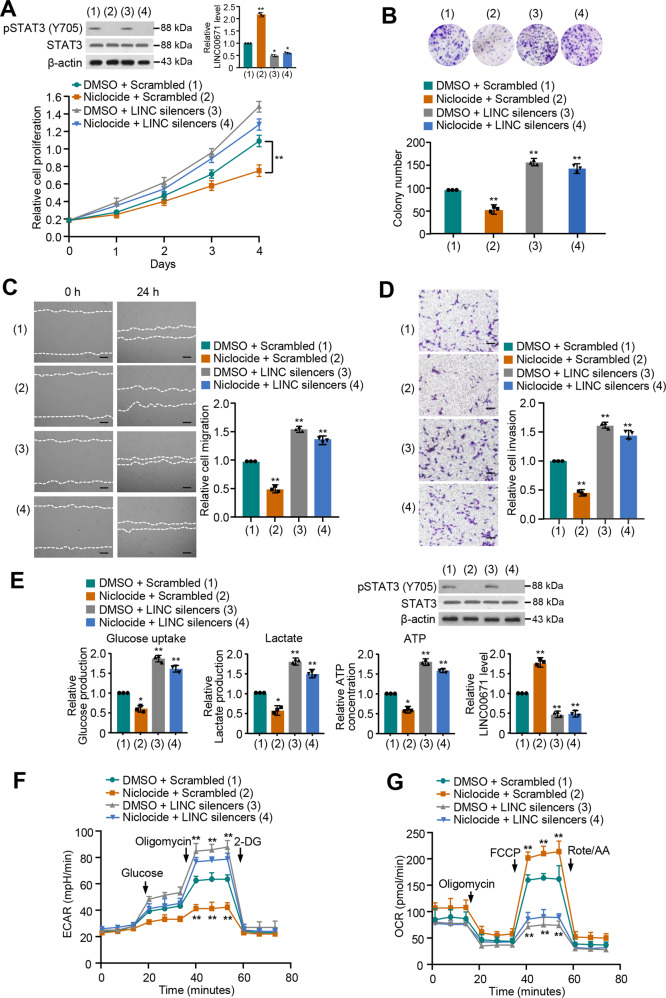
Fig. 5. STAT3 increases proliferation, migration, and invasion of thyroid cancer cells and activates glycolysis via regulation of LINC00671 expression.
A TPC-1 cells were transfected with LINC00671 smart pool of silencers and treated with Niclocide. The proliferation of the cells was detected by CCK-8 assay. The representative immunoblot shows pSTAT3 level. Histograms show LINC00671 expression determined by qRT-PCR. B Colony formation assay of TPC-1 cells transfected and treated as in (A). Representative images show colonies in plates (upper panels). Histograms show colony number. C, D Wound healing (C) and Transwell (D) assays of TPC-1 cells transfected and treated as in (A). Right histograms show the relative cell migration and invasion. E Glucose uptake and the production of lactate and ATP were determined. Representative immunoblot reveals the expression of pSTAT3. qRT-PCR analysis indicates LINC00671 expression. F, G TPC-1 cells were transfected and treated as in (A), and extracellular acidification rate (ECAR) (F), and oxygen consumption rate (OCR) (G) were then measured. The displayed values are the mean ± standard deviation. The triplicate measurement results were repeated 3 times and the results were similar. *P < 0.05, **P < 0.01 versus the corresponding control. Scale bar, 50 μm.

