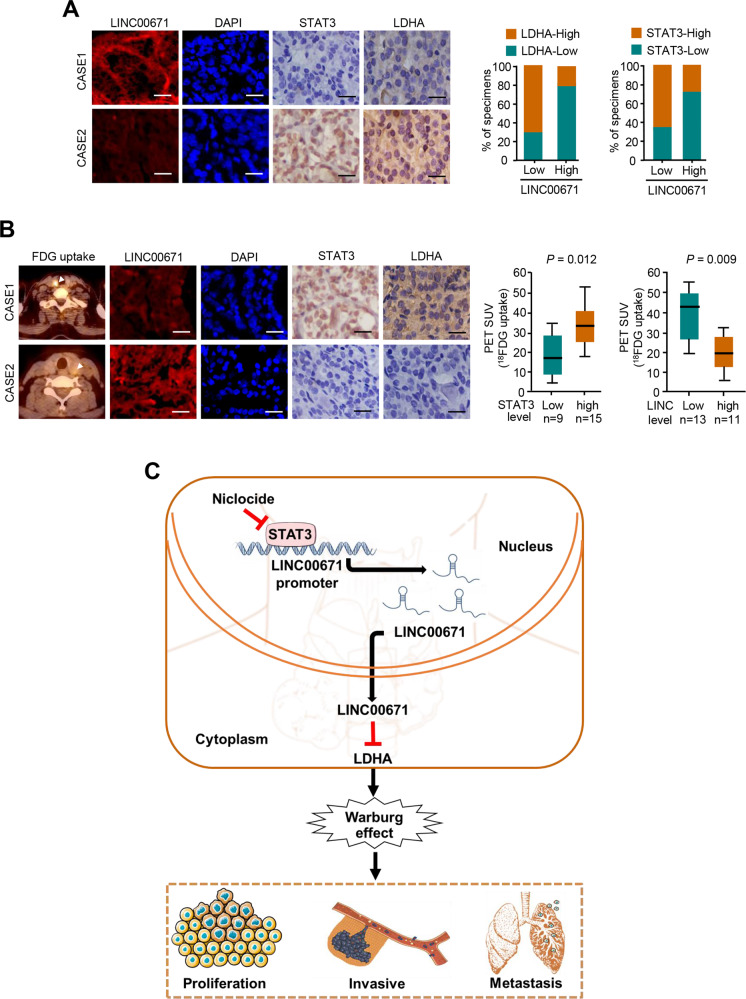
Fig. 7. Correlation between the expression of LINC00671 and LDHA and association of LINC00671 with glucose uptake in patients with thyroid cancer.
A Representative IHC staining for STAT3, LDHA, and FISH staining for LINC00671 in PTC patients. Scale bar, 50 μm. Right panel showing the percentage of specimens with low or high LDHA and STAT3 expressions in the low or high LINC00671 expression groups. CASE 1 and CASE 2 refer to two representative samples categorized by low and high LINC00671 expression. B The correlation of glucose uptake in thyroid cancer patients with different expressions of LDHA, STAT3, and LINC00671 using the Mann–Whitney U test. CASE 1 and CASE 2 refer to two representative samples categorized by low and high FDG uptake. Scale bar, 50 μm. C Graphical abstract underlying the role of the STAT3/LINC00671/LDHA axis in regulating PTC growth and lung metastasis.

