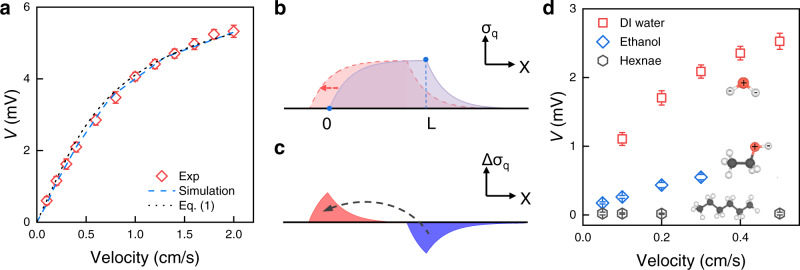
Fig. 3. Mechanism of the kinetic photovoltaic effect.
a Velocity dependence of the moving-light-induced voltage. The black dotted curve is the fit to Eq. (1), and the blue dashed curve is simulation prediction. b Blue solid curve and red dashed curve show simplified distribution of accumulated electron density in the vicinity of silicon surface at two moments for a light beam with a width of L moving to the left. The initial front and rear edge of the light beam are marked by “0” and “L”, respectively. c Difference of the accumulated electron density at two moments, i.e., red shaded area subtracted by blue shaded area in b, and the corresponding electron flow direction marked by a dark arrow. d Voltage as a function of velocity for p-type silicon in polar DI water, ethanol and nonpolar hexane, respectively. Error bars represent standard deviation. Insets show their molecular structures with labeled charge centers.

