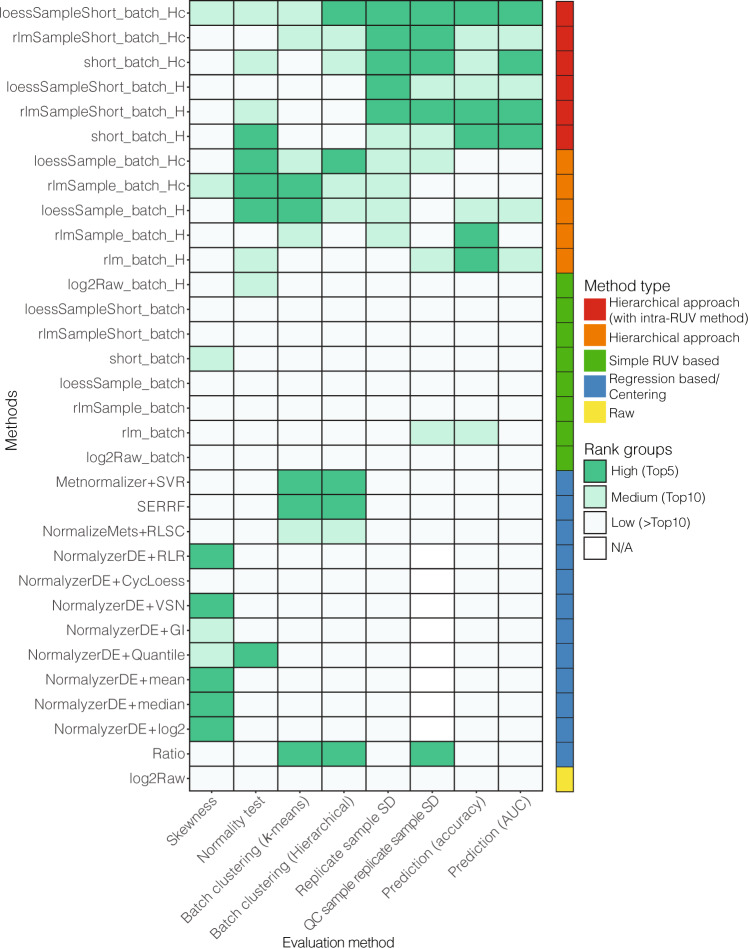
Fig. 4. Heatmap of rankings in all evaluations criteria.
The y axis represents all the methods explored in this study and the x axis represents all the qualitative evaluation metrics used for the evaluation of the integrated data. In each category, the evaluation scores are ranked and categorised into three groups, high, medium and low. The coloured bar on the right indicates the categorised method approaches consistent with Fig. 3b, c.

