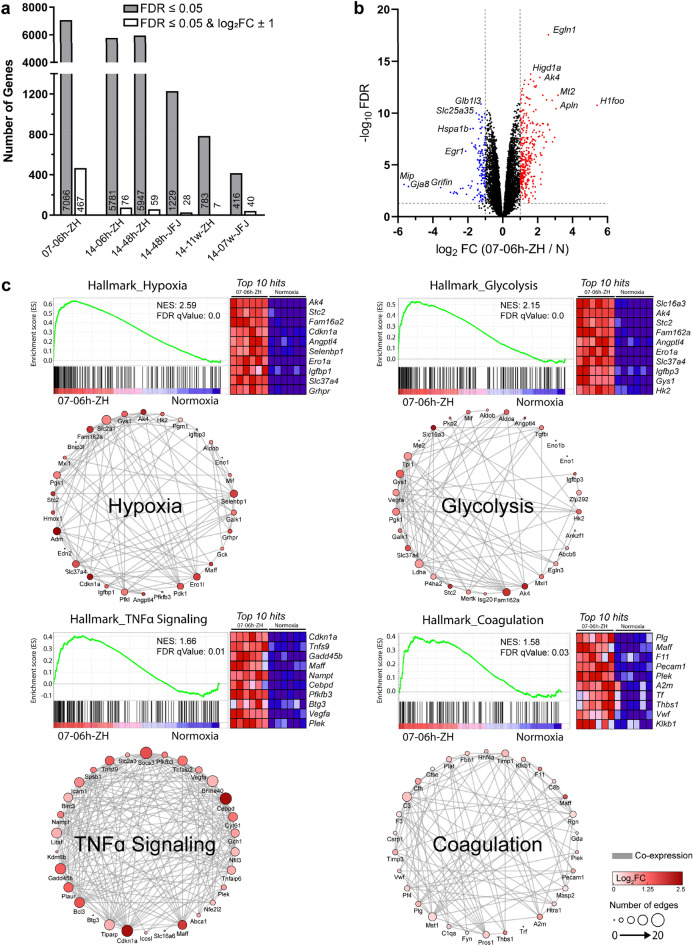
Figure 1.
Differentially expressed genes in the retina after hypoxic exposure. (a) Number of differentially expressed genes identified for each hypoxic condition. Shown are genes with an FDR ≤ 0.05 (grey bars) and genes that were additionally filtered for an FC ≥ ± 2 (white bars) compared to normoxic controls. Nomenclature of groups is defined according to Table 1. (b) Volcano plot representing differentially expressed genes in the 7% acute normobaric hypoxia (07-06 h-ZH) group. Up-regulated genes are shown in red and down-regulated genes in blue. Plot shows − log10 FDR versus log2 FC of each gene detected in acute hypoxia relative to normoxia (N). Threshold limit lines are set at an FDR of 0.05 and log2FC of ± 1. (c) Gene set enrichment analysis (GSEA) of 07-06 h-ZH (n = 6) compared with normoxia (n = 6) with MSigDB hallmark datasets. Heatmaps represent the top 10 upregulated genes in hypoxia for each hallmark set. Co-expression networks of top 30 enriched genes of each set. Nomenclature: ‘Oxygen percentage—duration of hypoxia—location of experiment’ is given in the name of each experimental group. ZH denotes normobaric and JFJ hypobaric hypoxic groups. N: normoxia; FC: fold change; FDRq: false discovery rate; NES: normalized enrichment score.

