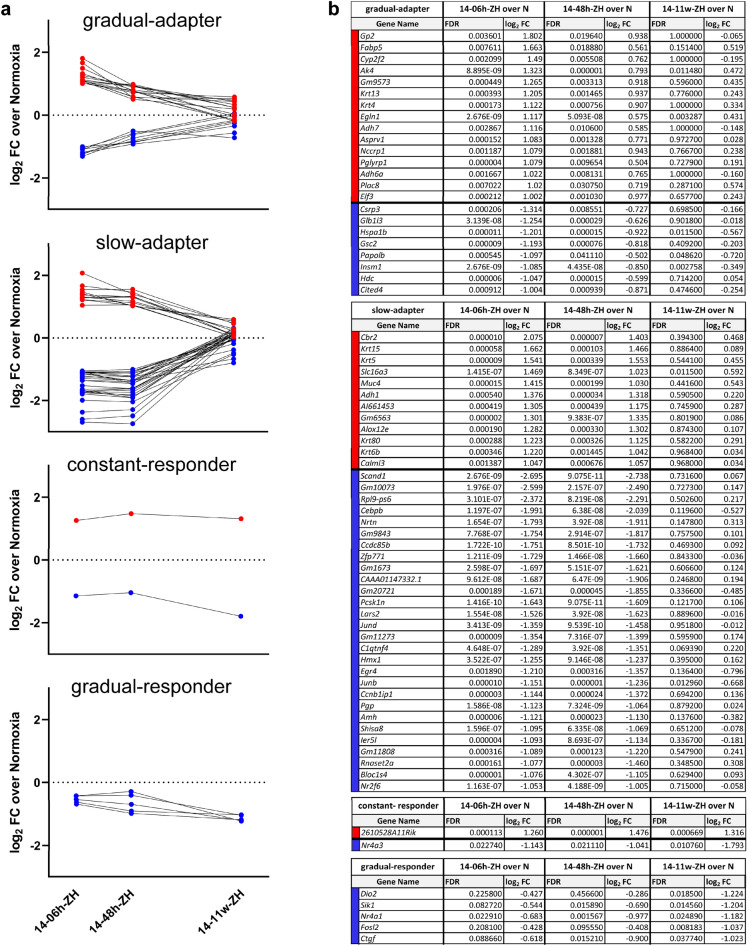
Figure 2.
Adaptation of retinal gene expression profiles to normobaric hypoxia. (a) Gene expression pattern (log2FC over normoxia) after exposure to normobaric 14% O2 for 6 h, 48 h, or 11 weeks. Genes were filtered into 4 gene sets based on their expression at each time point. (b) Individual genes within each set. Up-regulated genes are shown in red and down-regulated genes in blue. FC: fold change; FDR: false discovery rate; N: normoxia.

