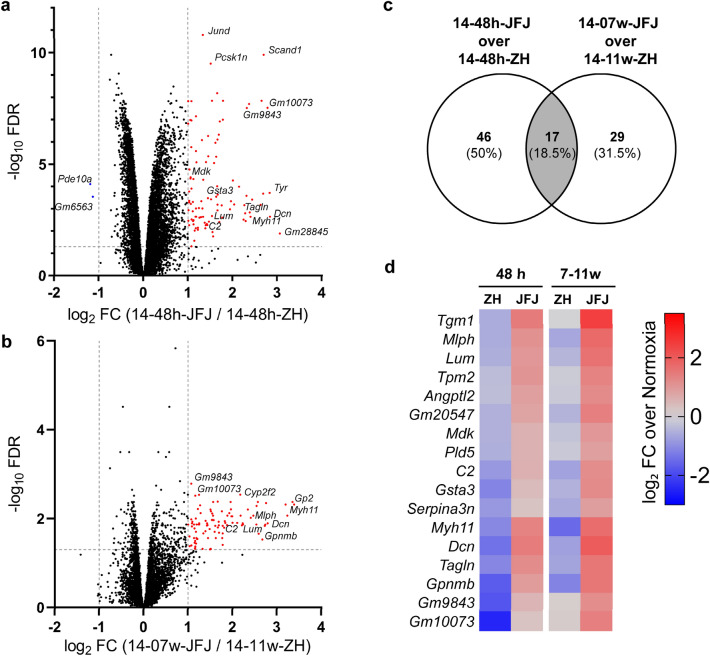
Figure 3.
Differentially expressed genes after exposure to normobaric or hypobaric hypoxia. Volcano plots representing up-regulated (red) and down-regulated (blue) genes comparing (a) acute exposure (14-48 h-JFJ to 14-48 h-ZH) and (b) prolonged exposure (14-07w-JFJ to 14-11w-ZH) to hypobaric and normobaric hypoxia. Threshold limit lines are set at FDR of 0.05 and log2FC of ± 1. (c) Venn diagram showing differentially regulated genes at each time-point and their overlap (grey). (d) Heatmap of the 17 shared genes identified in (c). Shown are up- (red) and down- (blue) regulated genes as log2 fold change (FC) over normoxia in the short- or long-term groups as indicated.

