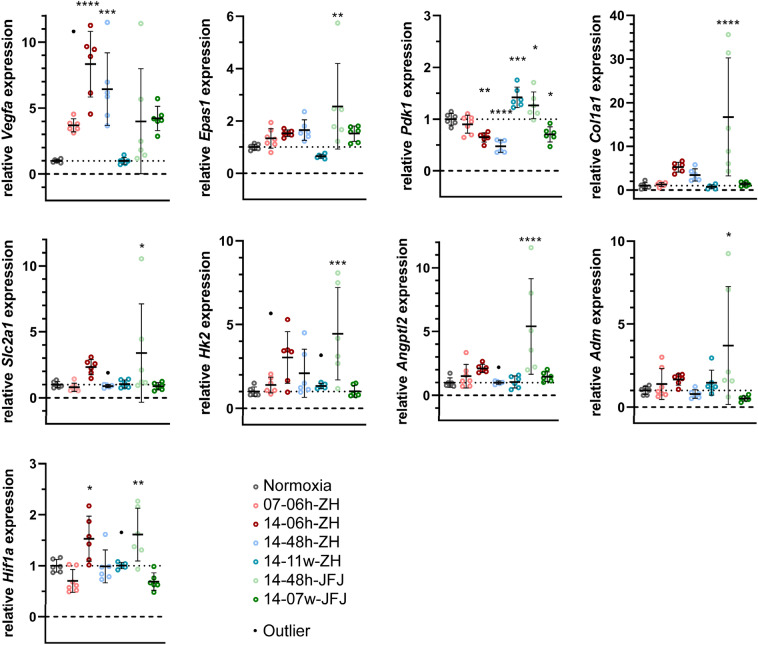
Figure 4.
Differentially expressed genes in the RPE. Expression of genes related to the hypoxic response (Hif1α, Epas1, Slc2a1, and Adm), glycolysis (Pdk1, Hk2), vascular perfusion (Vegfa, Angpt2), and choroidal connective tissue (Col1a1) was tested in eyecups by semiquantitative real-time PCR for all hypoxic conditions, as indicated. Expression levels were normalized to Actb and are shown relative to normoxic controls, which were set to 1 (dotted line). Shown are means ± SD of n = 6. Outliers detected by Grubb’s test (α = 0.01) are indicated as black dots and were excluded from statistical analysis. Significant differences of each condition to control (normoxia) was tested by one-way ANOVA with Dunnett’s multiple comparison test *p < 0.05; **p < 0.01; ***p < 0.001; ****p < 0.0001.

