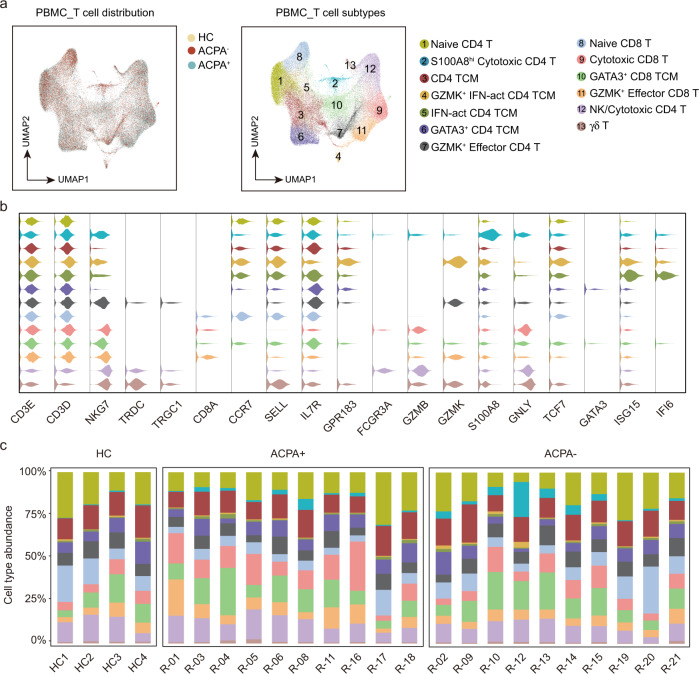
Fig. 7. Heterogeneous subpopulations of T and NK cell subsets in the blood of patients with RA.
a UMAP visualization of T/NK cells from PBMC, with 13 cell subtypes identified across 70,650 cells. Cells are marked by ACPA type(left) and cell subtypes (right). b Violin plots showing marker genes across PBMC T/NK cell subtypes in a. The y axis represents log-scaled normalized counts. c Bar plots showing the relative percentage of T/NK cell subtypes in PBMC for each sample.

