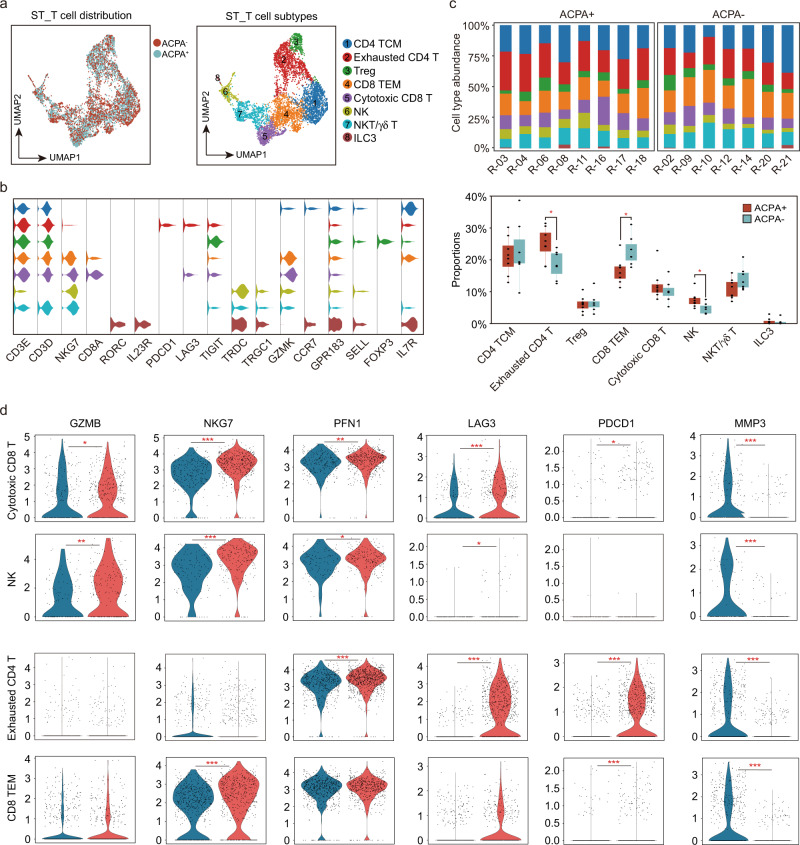
Fig. 9. Identification of synovial T and NK cell subsets in patients with RA.
a UMAP visualization of T/NK cells from STMC, with eight-cell subtypes identified across 5760 cells. b Violin plots showing marker genes across STMC T/NK cell subtypes in F. The y axis represents log-scaled normalized counts. c Top: bar plots showing the relative percentage of T/NK cell subtypes in STMC for each sample. Bottom: box plots showing the proportions of each T/NK cell subtype in STMC across ACPA groups. Cell types showed enrichment in ACPA+ or ACPA- subgroups are marked with *. P values were calculated by the two-side Wilcoxon test. *p < 0.05 (from left to right, p = 0.029, 0.014, 0.021). n = 10 for ACPA+ group, and n = 10 for ACPA- group. d Violin plots showing the differences in interested gene expression between ACPA- and ACPA+ T/NK cell subtypes in STMC. Asterisks indicate the significance. P values were calculated by the two-sided Wilcoxon test. *p < 0.05, **p < 0.01, ***p < 0.001.

