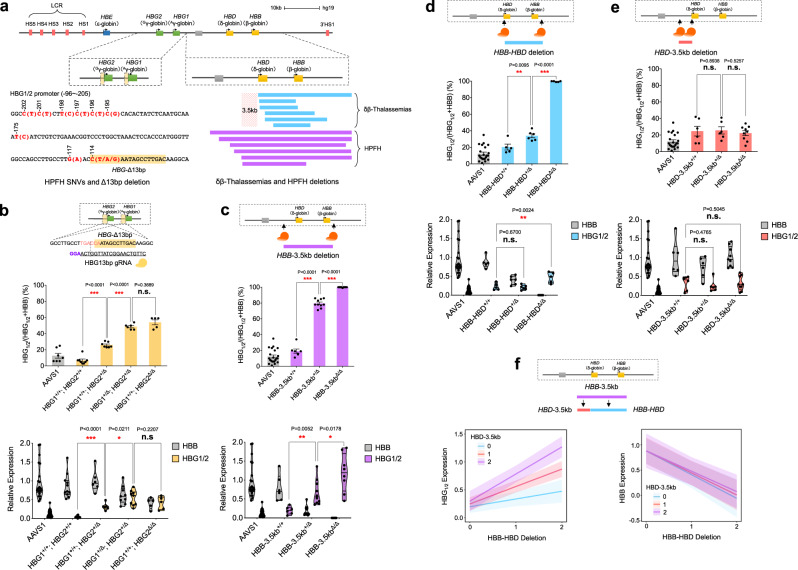
Fig. 1. Modulation of HbF regulation through recapitulation of specific cis-regulatory element perturbations in single cells.
a Schematic of HPFH SNVs and HBG-Δ13bp deletion at the proximal γ-globin promoter and large deletions within the β-globin locus that have been reported in individuals with δβ-thalassemias (blue) and HPFH (purple). SNV single-nucleotide variant, HPFH hereditary persistence of fetal hemoglobin, HBG-Δ13bp 13 bp deletion at the proximal HBG1/2 promoter −101 to −114. b Gene expression analysis for γ-globin (HBG1/2) and β-globin (HBB) mRNA in erythroid burst-forming units (BFU-E) derived from HSPC-derived erythroblasts upon genome editing of HBG-Δ13bp region in the HBG1, HBG2, or both promoters, n = 3 biologically independent experiments. Results are shown as mean ± SEM (P values are labeled on the top of each comparison. *P < 0.05, ***P < 0.001, n.s. statistically non-significant by a two-tailed Student’s t test). HBG1Δ, HBG2Δ: editing mutation within HBG-Δ13bp region. c–e Globin gene expression analysis in BFU-E upon genetic perturbations of elements composing the entire HBB-3.5kb deletion, n = 6 biologically independent experiments (c); HBB-HBD deletion, n = 3 biologically independent experiments (d); an HBD-3.5kb deletion, n = 3 biologically independent experiments (e). HBB-3.5kbΔ: region deletion starting from HBD upstream 3.5 kb to HBB 3’ end; HBB-HBDΔ: region deletion starting from HBD TSS to HBB 3’ end; HBD-3.5kb: deletion starting from HBD upstream 3.5 kb to HBD TSS. Results are shown as mean ± SEM (P values are labeled on the top of each comparison. *P < 0.05, **P < 0.01, ***P < 0.001, n.s. statistically non-significant by a two-tailed Student’s t test). f Quantitative modeling on HBG1/2 and HBB mRNA expression from genetic perturbations of elements composing HBB-HBD deletion combined with (red line and purple line)/without (blue line) HBD-3.5kb deletion using a linear mixed model. HBB-HBD deletion (0: +/+; 1: +/Δ; 2: Δ/Δ); HBD-3.5kb deletion (0: +/+; 1: +/Δ; 2: Δ/Δ). Modeling lines and bands are shown as mean ± 95% CI.

