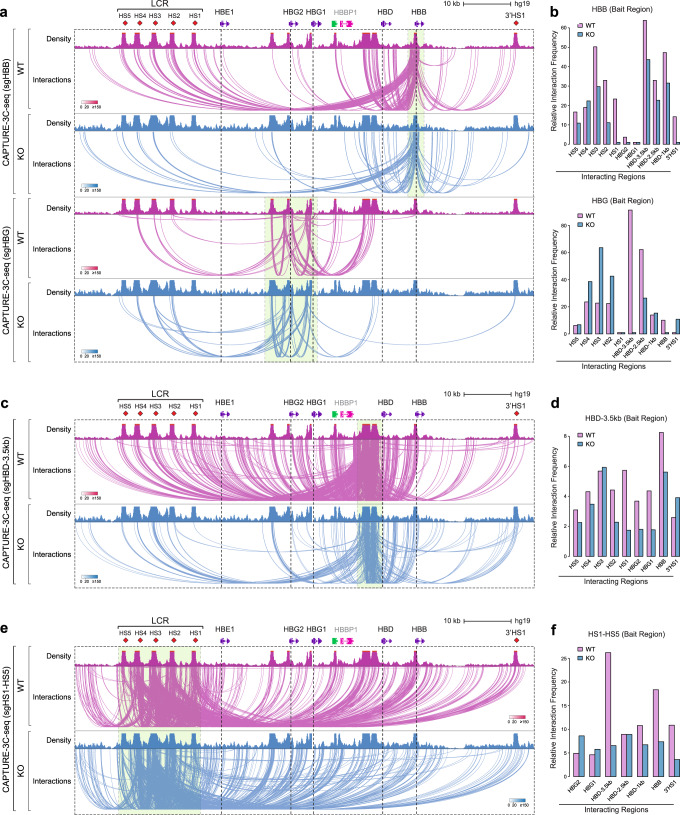
Fig. 4. Analysis of distinct β-globin locus cis-regulatory elements and BCL11A-dependent interactions using CAPTURE.
a, c, e Genome browser view of long-range DNA interactions in WT (purple) vs BCL11A KO (blue) HUDEP-2 cells using HBB, HBG (a), HBD-HBG intergenic region (c), and LCR (HS1-HS5) (e) as the capture bait region, respectively. b, d, f Quantitative analysis of relative interaction frequency between the captured bait and the interacting regions. Three anchor sites in the HBD-3.5kb interval region are shown as −3.5, −2.5, and −1 kb sites upstream of HBD.

