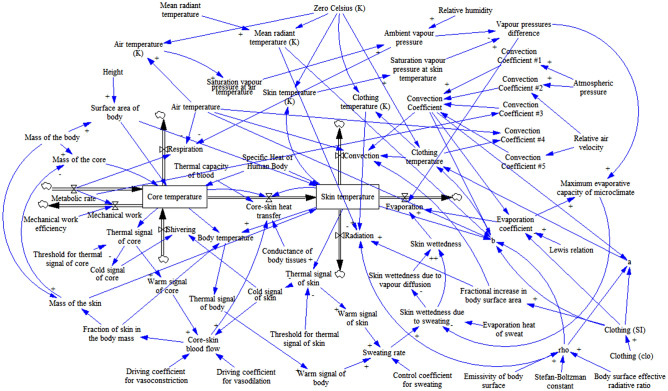
Figure 1.
Stocks-and-flows diagram of system dynamics model of human body thermal regulation50. Energy stocks (core and skin components of the body) are enclosed in rectangles. Energy flows are represented with the arrows with “valves”, where arrow direction indicates a positive direction of energy flow, but does not restrict the flow only in this direction. Parameters are represented with text labels, and blue arrows indicate causal relations between them, with polarity signs indicating the change of dependent variable with an increase in the governing variable.

