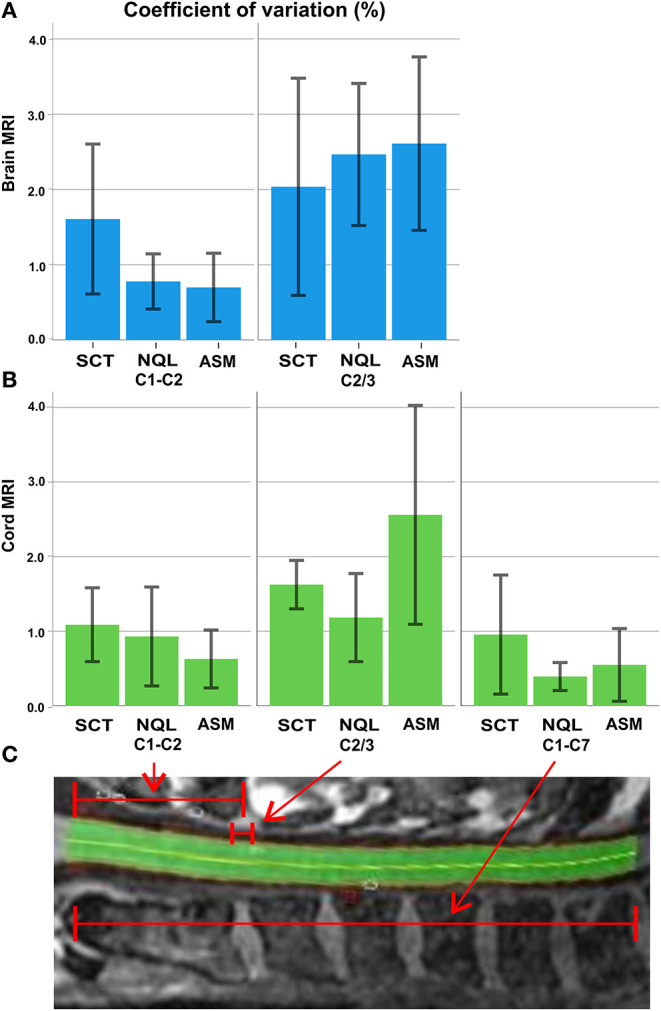
Figure 4.

Overview of the agreement between the evaluation methods averaged across all sites: (A) coefficient of variation (%; error bars: ± 1 standard deviation) of the three software methods for brain MRI at the C1–C2 level and C2/3 level; (B) coefficient of variation (%) of the three software methods for cord MRI at the C1–C2, C2/3, and C1–C7 level; (C) illustration of the C1–C2, C2/3, and C1–C7 sections of the cervical cord (example: an NQL segmentation).
