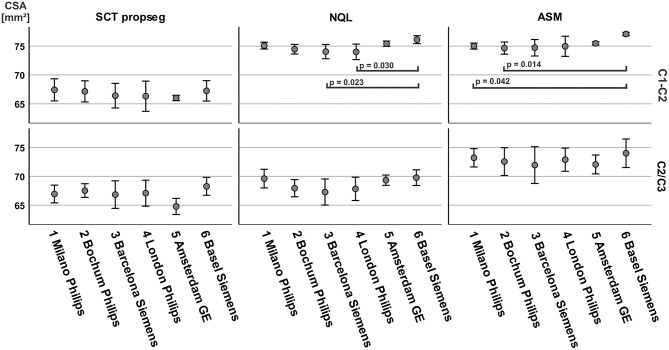
Figure 6.
Between-center comparison of cross-sectional area (CSA), differentiated for post-processing software and cord level. CSA was aggregated across brain and cord MRI (N = 6, for each center). Significance between groups by Kruskal–Wallis test with post-hoc comparisons between pairs of sites adjusted for multiple comparisons with Dunn's post-hoc test and Bonferroni adjustment.

