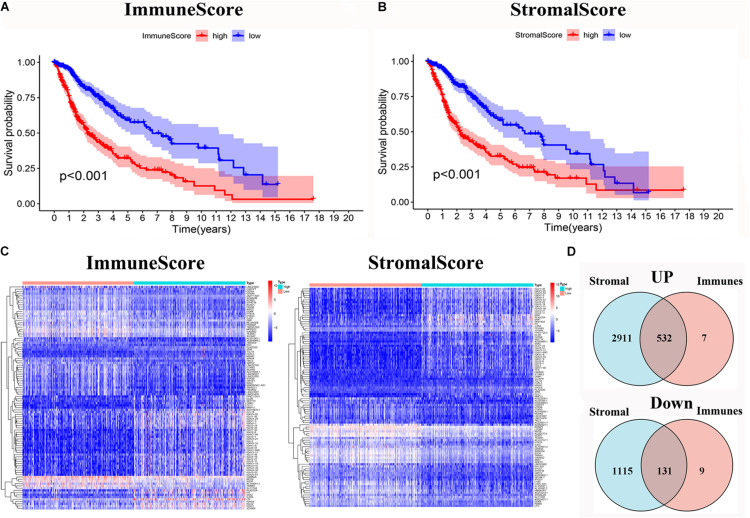
FIGURE 2.
Identification of DEGs based on immune score and stromal score. (A) Survival analysis of glioma between high and low Immune Score groups (p < 0.001). (B) Survival analysis of glioma between high and low Stromal Score groups (p < 0.001). (C) Heatmap of the 100 DEGs with the most significant p-values compared between the between the high and low immune score groups; Heatmap of the 100 DEGs with the most significant p-values compared between the high and low stromal score groups. (D) Venn diagram of the common up- and down-regulated DEG shared by Immune and Stromal Scores.

