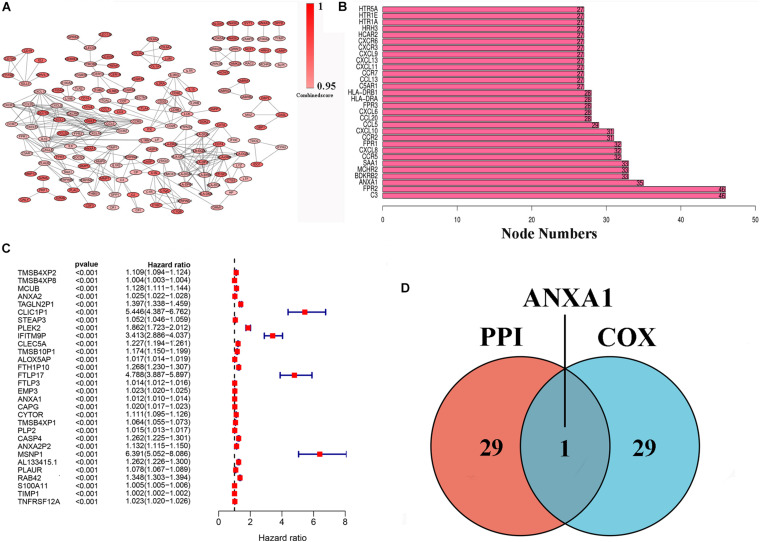
FIGURE 3.
PPI network and univariate Cox regression analysis of DEG. (A) PPI network was constructed by nodes with interaction confidence value > 0.95. (B) The top 30 genes in the order based on the number of adjacent nodes. (C) Univariate Cox regression analysis of DEGs, listing the top 30 significant factors with p < 0.0001. (D) Venn plot showing the common gene, ANXA1 shared by PPI and univariate Cox regression analysis.

