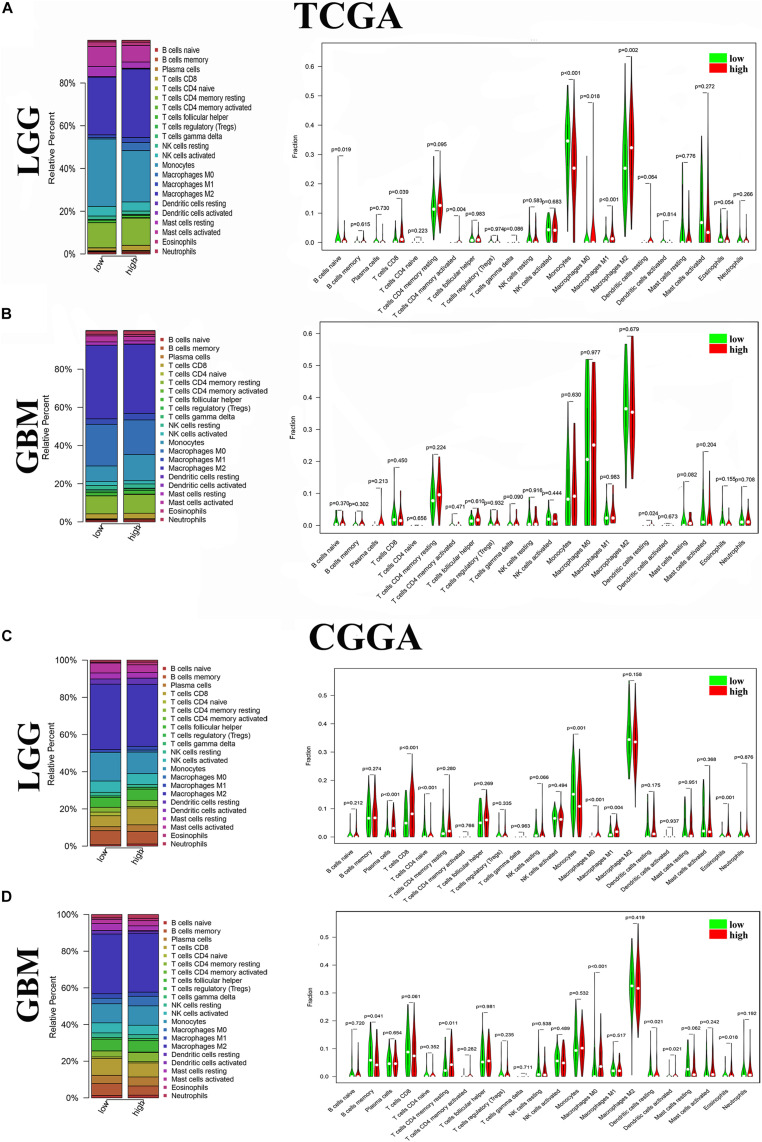
FIGURE 4.
Distribution of immune cells between high and low ANXA1 expression groups. (A) Proportions of immune cells and violin plot of LGG glioma samples from TCGA database. (B) Proportions of immune cells and violin plot of GBM glioma samples from TCGA database. (C) Proportions of immune cells and violin plot of LGG glioma samples from CGGA database. (D) Proportions of immune cells and violin plot of GBM glioma samples from CGGA databases.

