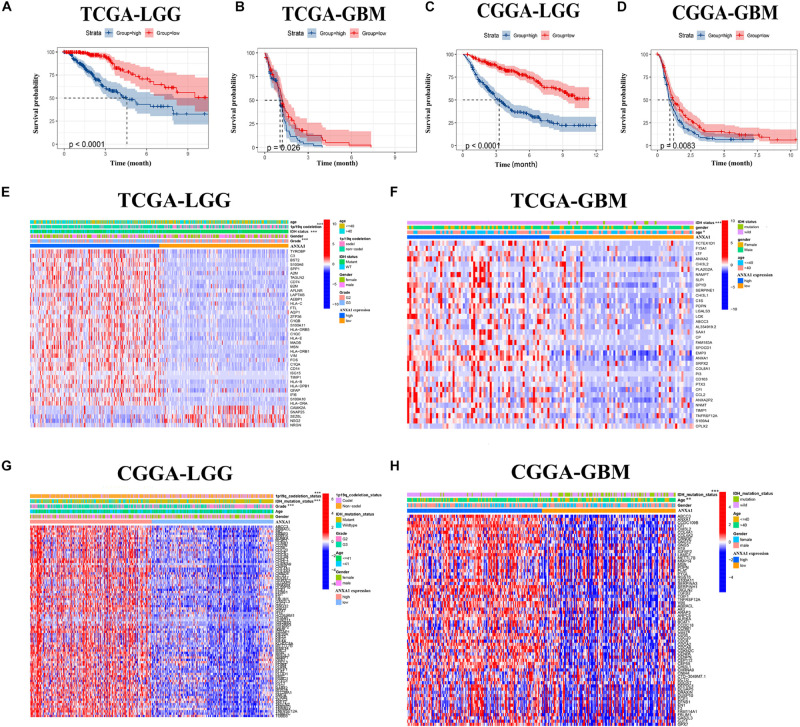
FIGURE 5.
The prognostic analysis and correlation of ANXA1 expression with clinical characteristics in glioma patients through the TCGA and CGGA database. (A,B) The prognostic analysis of ANXA1 in the LGG and GBM glioma samples from TCGA database. (C,D) The prognostic analysis of ANXA1 in the LGG and GBM glioma samples from CGGA database. (E,F) Different ANXA1 Expression Profiles and Clinicopathological Features in the LGG and GBM samples from the TCGA database; (G,H) Different ANXA1 Expression Profiles and Clinicopathological Features in the LGG and GBM samples from the CGGA database; *p < 0.05; **p < 0.01; ***p < 0.001.

